| 知乎专栏 | 多维度架构 |
常规测试是从入口发出请求,在网络畅通,较难分析出瓶颈。
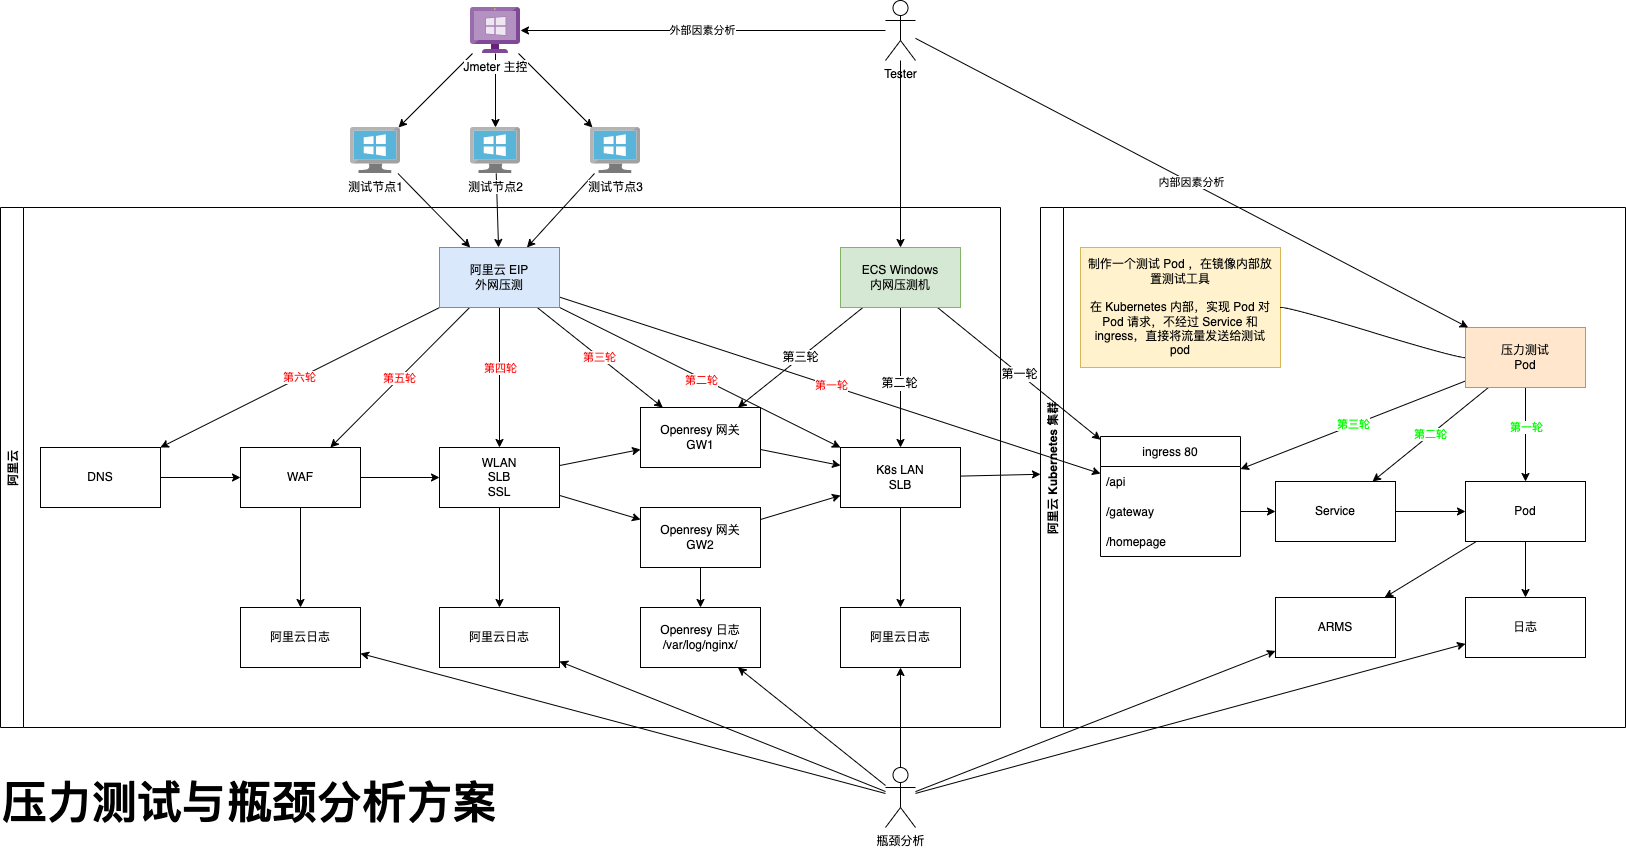
本次制定的新方案是逆向测试,用渗透的方式,测试从末端开始请求,对用户链路所经历的节点不断渗透,向用户端进发。这种方案可用于分析,外部和内部因素产生的性能瓶颈。
目的:
保障流量畅通达到数据库,再返回至用户。
以下列出优化的关键点:
注意:接口选择,不能选择有对接第三方的接口,第三方接口会影响到我们的 QPS
除此之外,还是注意服务器进程跟线程的启动原理,例如设置最大线程数8000,并不是服务器启动之后就会有8000个线程,而是最小可以只期待100个左右,随着链接数上升,系统不断开启新线程。启动线程的过程是很消耗资源的,会影响到测试结果。
所以一般,我们会去第二次压测数据为准。首次压测的目的是让服务器将该启动的线程和分配的资源,初始化好。
我们要准备几种接口:
第一轮:压 health
为什么压健康检查接口?因为它不会操作数据库和缓存也没有业务逻辑。压测该还接口对服务器资源消耗最小,同时能验证出服务器最大连接数设置是否又问题。
第二轮:压单服务接口,即该服务有业务逻辑也会访问数据库等资源,但是他不会链接其他接口。
对比两次压测结果,就知道带有业务逻辑之后,系统会下降多少性能
链接复用
location /api/ {
        proxy_http_version 1.1;
        proxy_set_header Host $host;
        proxy_set_header X-Real-IP $remote_addr;
        proxy_set_header REMOTE-HOST $remote_addr;
        proxy_set_header X-Forwarded-For $proxy_add_x_forwarded_for;
        proxy_pass http://gateway.netkiller.cn:8080/;
    }
/ # cat /proc/1/status | grep Threads
Threads:        61
另一中方式,记得数值要 -1 因为ls -l 第一行是 total 0 统计文件数量。
/ # ls -l /proc/1/task/ | wc -l
61
压力测试中,系统出现瓶颈,流量始终无法达到数据库。
开发小伙伴这样配置 Redis 由于太久脱离一线,我也不清楚配置是否正确,只能验证一下。
spring.redis.host=172.18.200.5
spring.redis.port=6379
spring.redis.password=passw0rd
spring.redis.database=0

spring.redis.pool.max-active=1000
spring.redis.pool.max-idle=10
spring.redis.pool.max-wait=-1
spring.redis.pool.min-idle=5
spring.redis.pool.timeout=1000
查看客户端连接数是 2
127.0.0.1:6379> info Clients
# Clients
connected_clients:2
cluster_connections:0
maxclients:10000
client_recent_max_input_buffer:8
client_recent_max_output_buffer:0
blocked_clients:0
tracking_clients:0
clients_in_timeout_table:0
创建一个空的 Springboot 项目,写一个最简单的接口,接口中做 set/get 操作。
	@Autowired
	private RedisTemplate<String, String> redisTemplate;

	@GetMapping("/redis")
	public String redis() {
		redisTemplate.opsForValue().set("name","neo",10, TimeUnit.SECONDS);
		String name = (String) redisTemplate.opsForValue().get("name");
		return name;
	}
使用 ab 命令压测一下
ab -c 100 -n 10000 http://localhost:8080/redis
观看连接池的状态
127.0.0.1:6379> info Clients
# Clients
connected_clients:2
cluster_connections:0
maxclients:10000
client_recent_max_input_buffer:8
client_recent_max_output_buffer:0
blocked_clients:0
tracking_clients:0
clients_in_timeout_table:0
connected_clients:2 数值没有变化,我的猜测果然是对的,这种配置我记得是 Spring 1.5 之前的。
网上说 Springboot 默认使用 lettuce
spring.redis.host=172.18.200.5
spring.redis.port=6379
spring.redis.password=passw0rd
spring.redis.database=0

spring.redis.lettuce.pool.enabled=true
spring.redis.lettuce.pool.max-active=1000
spring.redis.lettuce.pool.max-idle=80
spring.redis.lettuce.pool.min-idle=20
spring.redis.lettuce.pool.max-wait=-1ms
spring.redis.lettuce.shutdown-timeout=100ms
spring.cache.redis.cache-null-values=false
配置后使用 ab 压测,connected_clients:2 没有任何变化。
127.0.0.1:6379> info Clients
# Clients
connected_clients:2
cluster_connections:0
maxclients:10000
client_recent_max_input_buffer:8
client_recent_max_output_buffer:0
blocked_clients:0
tracking_clients:0
clients_in_timeout_table:0
开启 Springboot 调试模式 debug=true,启动需要引入 commons-pool2
		<dependency>
			<groupId>org.springframework.boot</groupId>
			<artifactId>spring-boot-starter-data-redis</artifactId>
		</dependency>
启动提示
Caused by: java.lang.NoClassDefFoundError: org/apache/commons/pool2/impl/GenericObjectPoolConfig
引入 commons-pool2 后启动成功
		<dependency>
			<groupId>org.apache.commons</groupId>
			<artifactId>commons-pool2</artifactId>
		</dependency>
虽然启动成功,但是 ab 压测仍然 connected_clients:2
127.0.0.1:6379> info Clients
# Clients
connected_clients:2
cluster_connections:0
maxclients:10000
client_recent_max_input_buffer:20480
client_recent_max_output_buffer:0
blocked_clients:0
tracking_clients:0
clients_in_timeout_table:0
只能在debug信息中找线索,发现 JedisConnectionConfiguration
   JedisConnectionConfiguration:
      Did not match:
         - @ConditionalOnClass did not find required classes 'org.apache.commons.pool2.impl.GenericObjectPool', 'redis.clients.jedis.Jedis' (OnClassCondition)
改为 jedis 试试,pom.xml
		<dependency>
			<groupId>org.springframework.boot</groupId>
			<artifactId>spring-boot-starter-data-redis</artifactId>
			<exclusions>
				<exclusion>
					<groupId>io.lettuce</groupId>
					<artifactId>lettuce-core</artifactId>
				</exclusion>
			</exclusions>
		</dependency>
		<dependency>
			<groupId>redis.clients</groupId>
			<artifactId>jedis</artifactId>
		</dependency>
配置文件做响应调整
spring.redis.jedis.pool.max-active=1000
spring.redis.jedis.pool.max-idle=80
spring.redis.jedis.pool.min-idle=20
spring.redis.jedis.pool.max-wait=-1
使用 ab 压测一轮,终于 connected_clients:190 上去了。
127.0.0.1:6379> info Clients
# Clients
connected_clients:190
cluster_connections:0
maxclients:10000
client_recent_max_input_buffer:20480
client_recent_max_output_buffer:0
blocked_clients:0
tracking_clients:0
clients_in_timeout_table:0
lettuce 连接池,始终还没有解决,目前先用 jedis,其实连接池是同质化产品,虽有性能差异,但差距非常小,对于项目整体而言可以说微乎其微。就如同 Tomcat 跟 Undertow 差距,有时我们需要整理考虑架构方案,并不是所有好工具组合后就一定是好产品。
很多时候人们从网上找到 springboot 文章,文章中说这样配置连接池,于是就复制站台到自己的配置文件中,也没有去深究,最终流到生产环境。
spring.datasource.max-idle=10
spring.datasource.max-wait=10000
spring.datasource.min-idle=5
spring.datasource.initial-size=5
spring.datasource.validation-query=SELECT 1
spring.datasource.test-on-borrow=false
spring.datasource.test-while-idle=true
spring.datasource.time-between-eviction-runs-millis=18800
spring.datasource.jdbc-interceptors=ConnectionState;SlowQueryReport(threshold=0)
上面的配置已经作废,目前 Springboot 默认使用 hikari 链接池,他的正确配置如下
spring.datasource.type=com.zaxxer.hikari.HikariDataSource
spring.datasource.hikari.minimum-idle=5
spring.datasource.hikari.maximum-pool-size=200
spring.datasource.hikari.auto-commit=true
spring.datasource.hikari.idle-timeout=30000
spring.datasource.hikari.pool-name=Hikari
spring.datasource.hikari.max-lifetime=55000
spring.datasource.hikari.connection-timeout=30000
spring.datasource.hikari.connection-test-query=SELECT 1
测试方法,写一个测试接口,里面运行一条 SQL 即可
	@Autowired
	private JdbcTemplate jdbcTemplate;

	@GetMapping("/jdbc")
	public String jdbc() {
		String query = "SELECT * from test where id = 10";
		return jdbcTemplate.queryForObject(query, (resultSet, i) -> {
			System.out.println(resultSet.getString(1) + "," + resultSet.getString(2) + "," + resultSet.getString(3));
			return ("OK");
		});
	}
然后压测这个接口,观察 show full processlist; 正常会不停的变化,如果没有任何变化,例如只启动了 8 个链接,就说明链接池配置没有生效。
mysql> show status like 'Threads%';
+-------------------+-------+
| Variable_name     | Value |
+-------------------+-------+
| Threads_cached    | 8     |
| Threads_connected | 40    |
| Threads_created   | 111   |
| Threads_running   | 1     |
+-------------------+-------+
4 rows in set (0.00 sec)

mysql> show full processlist;
+--------+------+-------------------+------+---------+------+----------+-----------------------+
| Id     | User | Host              | db   | Command | Time | State    | Info                  |
+--------+------+-------------------+------+---------+------+----------+-----------------------+
| 507077 | root | 172.20.0.1:50129  | NULL | Query   |    0 | starting | show full processlist |
| 507638 | root | 172.18.5.89:49605 | test | Sleep   |    0 |          | NULL                  |
| 507639 | root | 172.18.5.89:49707 | test | Sleep   |    0 |          | NULL                  |
| 507640 | root | 172.18.5.89:49734 | test | Sleep   |    0 |          | NULL                  |
| 507641 | root | 172.18.5.89:49744 | test | Sleep   |    0 |          | NULL                  |
| 507642 | root | 172.18.5.89:49766 | test | Sleep   |    0 |          | NULL                  |
| 507643 | root | 172.18.5.89:49817 | test | Sleep   |    0 |          | NULL                  |
| 507644 | root | 172.18.5.89:49900 | test | Sleep   |    0 |          | NULL                  |
| 507645 | root | 172.18.5.89:49994 | test | Sleep   |    0 |          | NULL                  |
| 507647 | root | 172.18.5.89:50153 | test | Sleep   |    0 |          | NULL                  |
| 507648 | root | 172.18.5.89:50355 | test | Sleep   |    0 |          | NULL                  |
| 507649 | root | 172.18.5.89:50507 | test | Sleep   |    0 |          | NULL                  |
| 507650 | root | 172.18.5.89:50627 | test | Sleep   |    0 |          | NULL                  |
| 507651 | root | 172.18.5.89:50796 | test | Sleep   |    0 |          | NULL                  |
| 507652 | root | 172.18.5.89:51105 | test | Sleep   |    0 |          | NULL                  |
| 507653 | root | 172.18.5.89:51373 | test | Sleep   |    0 |          | NULL                  |
| 507654 | root | 172.18.5.89:51598 | test | Sleep   |    0 |          | NULL                  |
| 507655 | root | 172.18.5.89:52063 | test | Sleep   |    0 |          | NULL                  |
| 507656 | root | 172.18.5.89:52605 | test | Sleep   |    0 |          | NULL                  |
| 507657 | root | 172.18.5.89:53186 | test | Sleep   |    0 |          | NULL                  |
| 507658 | root | 172.18.5.89:53621 | test | Sleep   |    0 |          | NULL                  |
| 507659 | root | 172.18.5.89:53955 | test | Sleep   |    0 |          | NULL                  |
| 507660 | root | 172.18.5.89:54126 | test | Sleep   |    0 |          | NULL                  |
| 507661 | root | 172.18.5.89:54946 | test | Sleep   |    0 |          | NULL                  |
| 507662 | root | 172.18.5.89:55164 | test | Sleep   |    0 |          | NULL                  |
| 507663 | root | 172.18.5.89:55517 | test | Sleep   |    0 |          | NULL                  |
| 507666 | root | 172.18.5.89:56070 | test | Sleep   |    0 |          | NULL                  |
| 507667 | root | 172.18.5.89:56431 | test | Sleep   |    0 |          | NULL                  |
| 507668 | root | 172.18.5.89:56828 | test | Sleep   |    0 |          | NULL                  |
| 507669 | root | 172.18.5.89:57421 | test | Sleep   |    0 |          | NULL                  |
| 507670 | root | 172.18.5.89:57801 | test | Sleep   |    0 |          | NULL                  |
| 507671 | root | 172.18.5.89:58105 | test | Sleep   |    0 |          | NULL                  |
| 507672 | root | 172.18.5.89:58541 | test | Sleep   |    0 |          | NULL                  |
| 507675 | root | 172.18.5.89:59031 | test | Sleep   |    0 |          | NULL                  |
| 507676 | root | 172.18.5.89:59504 | test | Sleep   |    0 |          | NULL                  |
+--------+------+-------------------+------+---------+------+----------+-----------------------+
35 rows in set (0.00 sec)
在公司代码库中找到这样的配置,总觉得不对,我最后一次写代码是 2017 年,最开始叫 Feign 后来改为 Openfeign,为了分析出整个系统的瓶颈,有必要深挖一下 Feign/Openfeign。
spring:
  feign:
    httpclient:
      enabled: true
大多数人的学习路径是看书或去网上找别人的文章,复制里面的代码和配置。这种学习方式有两个弊端,书上的内容知识更新太慢,版本比较旧。网上找文章也是如此,别人的例子就是编译不通过,配置也很多是过时或错误的,一股脑,不做验证的饮引用别人的代码和配置。我更习惯看官网文档和翻看官方源码。
上面的配置就很可能某小伙伴,在网上看到别人那样配置,然后复制过来,就上生产了,并且这段配置在公司已经存在很多年,所有人都没有质疑过,直到我来公司,解决系统瓶颈问题才发现。
下面再说 okhttp 的问题,okhttp 在 openfeign 项目中并不成熟,属于实验产品。配置项只有 feign.okhttp.enabled,没有 max-connections 配置。
        <dependency>
            <groupId>org.springframework.cloud</groupId>
            <artifactId>spring-cloud-starter-openfeign</artifactId>
        </dependency>
面临问题:如果使用 okhttp 怎么设置 max-connections,于是我便翻看 spring-cloud-starter-openfeign 源码,请看 openfeign 源码 https://github.com/spring-cloud/spring-cloud-openfeign/blob/main/spring-cloud-openfeign-core/src/main/java/org/springframework/cloud/openfeign/support/FeignHttpClientProperties.java,明显 openfeign 源码没有体现 feign.okhttp.max-connections。如果强行使用 okhttp 只能这样设置
# 禁用 httpclient
feign.httpclient.enabled=false
# 启用 okhttp
feign.okhttp.enabled=true
# 因为没有提供 feign.okhttp.max-connections,只能用这种方式,从代码上看feign.httpclient.enabled=false并不影响这样使用
feign.httpclient.max-connections=1000
feign.httpclient.max-connections-per-route=50
另有新发现,重点看这里 @ConfigurationProperties(prefix = "spring.cloud.openfeign.httpclient") 如果是这样 spring.cloud.openfeign.httpclient
那我的配置应该必须是
spring.cloud.openfeign.httpclient.max-connections=200

可是官网手册上写:
feign.httpclient.max-connections=200
所以,官网手册也有滞后,我看的源码是 Openfeign 3.x 版本的,也就是说下一个版本 Openfeign 的配置文件将改为 spring.cloud.openfeign 前缀,同时 Openfeign 3.x 也没有解决 okhttp 的 max-connections 配置问题,还是这样使用 spring.cloud.openfeign.httpclient.max-connections=1000
spring.cloud.openfeign.httpclient.enabled=false
spring.cloud.openfeign.okhttp.enabled=true
spring.cloud.openfeign.httpclient.max-connections=1000
spring.cloud.openfeign.httpclient.max-connections-per-route=50
如果我年轻10年,以我的性格会吧这个缺陷修复了,然后 merge request 到官网,现在让给年轻人做吧。
[neo@linux ~]$ last reboot
reboot   system boot  2.6.18-164.15.1. Wed Apr 28 23:43         (6+21:31)
reboot   system boot  2.6.18-164.15.1. Fri Apr 16 04:07         (12+19:23)
reboot   system boot  2.6.18-164.15.1. Fri Apr 16 02:19          (01:46)
reboot   system boot  2.6.18-164.el5   Thu Apr 15 18:52          (07:25)

wtmp begins Thu Apr 15 18:52:15 2010
free - Display amount of free and used memory in the system
$ free
             total       used       free     shared    buffers     cached
Mem:       2053440     522028    1531412          0      87076     265952
-/+ buffers/cache:     169000    1884440
Swap:      2441840          0    2441840
5秒监控一次
neo@neo-OptiPlex-780:~/workspace/Document$ free -s 5
             total       used       free     shared    buffers     cached
Mem:       2054224    1708876     345348          0      58908     696404
-/+ buffers/cache:     953564    1100660
Swap:      2077692      81948    1995744

             total       used       free     shared    buffers     cached
Mem:       2054224    1708876     345348          0      58908     696404
-/+ buffers/cache:     953564    1100660
Swap:      2077692      81948    1995744

             total       used       free     shared    buffers     cached
Mem:       2054224    1709000     345224          0      58908     696404
-/+ buffers/cache:     953688    1100536
Swap:      2077692      81948    1995744
vmstat
# vmstat
procs -----------memory---------- ---swap-- -----io---- --system-- ----cpu----
 r  b   swpd   free   buff  cache   si   so    bi    bo   in    cs us sy id wa
 0  0      0 203668  53352 2878928    0    0     0     2    4     6  0  0 100  0
procs:
r		;在运行队列中等待的进程数
b		;在等待io的进程数
w		;可以进入运行队列但被替换的进程

memoy
swap	;现时可用的交换内存(k表示)
free	;空闲的内存(k表示)

pages
re        回收的页面
mf        非严重错误的页面
pi        进入页面数(k表示)
po        出页面数(k表示)
fr        空余的页面数(k表示)
de        提前读入的页面中的未命中数
sr        通过时钟算法扫描的页面

disk 显示每秒的磁盘操作。 s表示scsi盘,0表示盘号

fault 显示每秒的中断数
in        设备中断
sy        系统中断
cy        cpu交换

cpu 表示cpu的使用状态
cs        用户进程使用的时间
sy        系统进程使用的时间
id        cpu空闲的时间
$ vmstat 1
procs -----------memory---------- ---swap-- -----io---- -system-- ----cpu----
 r  b   swpd   free   buff  cache   si   so    bi    bo   in   cs us sy id wa
 2  0      0 2692472 347884 442576    0    0     0    54   11    7 99  1  0  0
 2  0      0 2692420 347884 442600    0    0     0     0    6   87 100  0  0  0
 2  1      0 2692320 347884 442600    0    0     0  2568   26  121 100  0  0  0
 2  0      0 2687872 347884 442600    0    0     0    72   28  129 100  1  0  0
 2  0      0 2684716 347884 442600    0    0     0     0   16   91 100  0  0  0
 2  0      0 2680528 347884 442600    0    0     0     0   12   88 100  1  0  0

vmstat 参数详解

procs:
r-->在运行队列中等待的进程数
b-->在等待io的进程数
w-->可以进入运行队列但被替换的进程

memoy
swap-->现时可用的交换内存(k表示)
free-->空闲的内存(k表示)

pages
re--》回收的页面
mf--》非严重错误的页面
pi--》进入页面数(k表示)
po--》出页面数(k表示)
fr--》空余的页面数(k表示)
de--》提前读入的页面中的未命中数
sr--》通过时钟算法扫描的页面

disk 显示每秒的磁盘操作。 s表示scsi盘,0表示盘号

fault 显示每秒的中断数
in--》设备中断
sy--》系统中断
cy--》cpu交换

cpu 表示cpu的使用状态
cs--》用户进程使用的时间
sy--》系统进程使用的时间
id--》cpu空闲的时间
# mpstat -P ALL
Linux 2.6.18-194.el5 (cms)      08/30/2010

07:30:56 PM  CPU   %user   %nice    %sys %iowait    %irq   %soft  %steal   %idle    intr/s
07:30:56 PM  all    0.73    0.00    3.91    0.61    0.02    0.11    0.00   94.62   1380.14
07:30:56 PM    0    1.62    0.00    5.40    1.82    0.08    0.42    0.00   90.65   1375.30
07:30:56 PM    1    0.35    0.00    3.78    0.21    0.00    0.00    0.00   95.66      0.00
07:30:56 PM    2    0.44    0.00    2.74    0.22    0.00    0.00    0.00   96.59      0.00
07:30:56 PM    3    0.50    0.00    3.72    0.20    0.00    0.00    0.00   95.59      0.00
# pmap -d PID
[root@development ~]# pmap -d 3817
3817:   /sbin/mingetty tty3
Address           Kbytes Mode  Offset           Device    Mapping
0000000000400000      12 r-x-- 0000000000000000 008:00002 mingetty
0000000000602000       8 rw--- 0000000000002000 008:00002 mingetty
000000001b9f8000     132 rw--- 000000001b9f8000 000:00000   [ anon ]
0000003fd8200000     112 r-x-- 0000000000000000 008:00002 ld-2.5.so
0000003fd841b000       4 r---- 000000000001b000 008:00002 ld-2.5.so
0000003fd841c000       4 rw--- 000000000001c000 008:00002 ld-2.5.so
0000003fd9200000    1332 r-x-- 0000000000000000 008:00002 libc-2.5.so
0000003fd934d000    2048 ----- 000000000014d000 008:00002 libc-2.5.so
0000003fd954d000      16 r---- 000000000014d000 008:00002 libc-2.5.so
0000003fd9551000       4 rw--- 0000000000151000 008:00002 libc-2.5.so
0000003fd9552000      20 rw--- 0000003fd9552000 000:00000   [ anon ]
00002ba6fbb68000       8 rw--- 00002ba6fbb68000 000:00000   [ anon ]
00002ba6fbb7d000       8 rw--- 00002ba6fbb7d000 000:00000   [ anon ]
00007fff2ba17000      84 rw--- 00007ffffffea000 000:00000   [ stack ]
ffffffffff600000    8192 ----- 0000000000000000 000:00000   [ anon ]
mapped: 11984K    writeable/private: 268K    shared: 0K
uptime
# uptime
 21:26:06 up 15 days, 58 min,  1 user,  load average: 0.85, 1.16, 2.21
ATOP - ubuntu                        2013/03/12  16:09:34                        ------                        10s elapsed
PRC |  sys    0.03s  |  user   0.01s |  #proc    104  |  #tslpi   184  |  #tslpu     0  | #zombie    0  |  #exit      0  |
CPU |  sys       0%  |  user      0% |  irq       0%  |  idle    399%  |  wait      1%  | curf 2.13GHz  |  curscal   ?%  |
cpu |  sys       0%  |  user      0% |  irq       0%  |  idle    100%  |  cpu000 w  0%  | curf 2.13GHz  |  curscal   ?%  |
cpu |  sys       0%  |  user      0% |  irq       0%  |  idle    100%  |  cpu002 w  0%  | curf 2.13GHz  |  curscal   ?%  |
CPL |  avg1    0.00  |  avg5    0.01 |  avg15   0.05  |  csw      694  |  intr     351  |               |  numcpu     4  |
MEM |  tot     1.9G  |  free    1.4G |  cache 219.7M  |  dirty   0.0M  |  buff   93.5M  | slab   39.3M  |                |
SWP |  tot     2.0G  |  free    2.0G |                |                |                | vmcom 338.8M  |  vmlim   2.9G  |
LVM |   ubuntu-root  |  busy      1% |  read       0  |  write      9  |  MBr/s   0.00  | MBw/s   0.00  |  avio 8.44 ms  |
NET |  transport     |  tcpi      11 |  tcpo       9  |  udpi       2  |  udpo       2  | tcpao      0  |  tcppo      0  |
NET |  network       |  ipi       16 |  ipo       12  |  ipfrw      0  |  deliv     15  | icmpi      0  |  icmpo      0  |
NET |  eth0    ----  |  pcki      23 |  pcko      14  |  si    2 Kbps  |  so    2 Kbps  | erri       0  |  erro       0  |

  PID  RUID      EUID       THR   SYSCPU   USRCPU   VGROW   RGROW   RDDSK   WRDSK  ST  EXC  S  CPUNR   CPU  CMD        1/1
 5571  root      root         1    0.01s    0.00s      0K      0K      0K      0K  --    -  R      0    0%  atop
 1188  postgres  postgres     1    0.01s    0.00s      0K      0K      0K      0K  --    -  S      1    0%  postgres
 1256  redis     redis        3    0.00s    0.01s      0K      0K      0K      0K  --    -  S      2    0%  redis-server
  247  root      root         1    0.01s    0.00s      0K      0K      0K      0K  --    -  S      0    0%  kworker/0:1
 1229  ntop      ntop        11    0.00s    0.00s      0K      0K      0K      0K  --    -  S      3    0%  ntop
  920  whoopsie  whoopsie     2    0.00s    0.00s      0K      0K      0K      0K  --    -  S      3    0%  whoopsie
  914  root      root         1    0.00s    0.00s      0K      0K      0K      0K  --    -  S      1    0%  irqbalance
  265  root      root         1    0.00s    0.00s      0K      0K      0K     16K  --    -  S      1    0%  jbd2/dm-0-8
[root@netkiller ~]# grep VmRSS /proc/82356/status
VmRSS:	    3156 kB
[root@netkiller ~]# pmap -x 82356
82356:   /usr/sbin/chronyd -F 2
Address           Kbytes     RSS   Dirty Mode  Mapping
0000560e1f563000      16      16       0 r---- chronyd
0000560e1f567000     236     236       0 r-x-- chronyd
0000560e1f5a2000      64      64       0 r---- chronyd
0000560e1f5b3000       4       4       4 r---- chronyd
0000560e1f5b4000       4       4       4 rw--- chronyd
0000560e1f5b5000       4       4       4 rw---   [ anon ]
0000560e1f92a000     132     132     132 rw---   [ anon ]
0000560e1f94b000     148     108     108 rw---   [ anon ]
00007f6870000000     132      12      12 rw---   [ anon ]
00007f6870021000   65404       0       0 -----   [ anon ]
00007f6874f3b000       4       0       0 -----   [ anon ]
00007f6874f3c000    8192      20      20 rw---   [ anon ]
00007f687573c000       8       8       0 r---- libnss_sss.so.2
00007f687573e000      28      28       0 r-x-- libnss_sss.so.2
00007f6875745000       8       8       0 r---- libnss_sss.so.2
00007f6875747000       4       4       4 r---- libnss_sss.so.2
00007f6875748000       4       4       4 rw--- libnss_sss.so.2
00007f6875749000       8       8       8 rw---   [ anon ]
00007f687574b000       8       8       0 r---- libffi.so.8.1.0
00007f687574d000      24       0       0 r-x-- libffi.so.8.1.0
00007f6875753000       8       0       0 r---- libffi.so.8.1.0
00007f6875755000       4       4       4 r---- libffi.so.8.1.0
00007f6875756000       4       4       4 rw--- libffi.so.8.1.0
00007f6875757000       8       8       8 rw---   [ anon ]
00007f6875759000      68      68       0 r---- libgmp.so.10.4.0
00007f687576a000     488       0       0 r-x-- libgmp.so.10.4.0
00007f68757e4000      92       0       0 r---- libgmp.so.10.4.0
00007f68757fb000       8       8       8 r---- libgmp.so.10.4.0
00007f68757fd000       4       4       4 rw--- libgmp.so.10.4.0
00007f68757fe000      36      36       0 r---- libhogweed.so.6.4
00007f6875807000      80       0       0 r-x-- libhogweed.so.6.4
00007f687581b000     140       0       0 r---- libhogweed.so.6.4
00007f687583e000       8       8       8 r---- libhogweed.so.6.4
00007f6875840000       4       0       0 rw---   [ anon ]
00007f6875841000      12      12       0 r---- libtasn1.so.6.6.0
00007f6875844000      56       0       0 r-x-- libtasn1.so.6.6.0
00007f6875852000      16       0       0 r---- libtasn1.so.6.6.0
00007f6875856000       4       0       0 ----- libtasn1.so.6.6.0
00007f6875857000       4       4       4 r---- libtasn1.so.6.6.0
00007f6875858000       4       0       0 rw---   [ anon ]
00007f6875859000      68      68       0 r---- libunistring.so.2.1.0
00007f687586a000     224       0       0 r-x-- libunistring.so.2.1.0
00007f68758a2000    1244       0       0 r---- libunistring.so.2.1.0
00007f68759d9000      16      16      16 r---- libunistring.so.2.1.0
00007f68759dd000       4       4       4 rw--- libunistring.so.2.1.0
00007f68759de000       8       8       0 r---- libidn2.so.0.3.7
00007f68759e0000      16       0       0 r-x-- libidn2.so.0.3.7
00007f68759e4000     100       0       0 r---- libidn2.so.0.3.7
00007f68759fd000       4       4       4 r---- libidn2.so.0.3.7
00007f68759fe000       4       0       0 rw---   [ anon ]
00007f68759ff000     164      68       0 r---- libp11-kit.so.0.3.0
00007f6875a28000     636      28       0 r-x-- libp11-kit.so.0.3.0
00007f6875ac7000     348       0       0 r---- libp11-kit.so.0.3.0
00007f6875b1e000      40      40      40 r---- libp11-kit.so.0.3.0
00007f6875b28000      40      40      40 rw--- libp11-kit.so.0.3.0
00007f6875b32000       8       8       8 rw---   [ anon ]
00007f6875b34000     176     176       0 r---- libc.so.6
00007f6875b60000    1496    1328       0 r-x-- libc.so.6
00007f6875cd6000     336     164       0 r---- libc.so.6
00007f6875d2a000       4       0       0 ----- libc.so.6
00007f6875d2b000      12      12      12 r---- libc.so.6
00007f6875d2e000      12      12      12 rw--- libc.so.6
00007f6875d31000      52      24      24 rw---   [ anon ]
00007f6875d3e000       8       8       0 r---- libseccomp.so.2.5.2
00007f6875d40000      56      56       0 r-x-- libseccomp.so.2.5.2
00007f6875d4e000      52      52       0 r---- libseccomp.so.2.5.2
00007f6875d5b000       4       0       0 ----- libseccomp.so.2.5.2
00007f6875d5c000       4       4       4 r---- libseccomp.so.2.5.2
00007f6875d5d000       4       4       4 rw--- libseccomp.so.2.5.2
00007f6875d5e000       8       8       0 r---- libcap.so.2.48
00007f6875d60000      16      16       0 r-x-- libcap.so.2.48
00007f6875d64000       8       8       0 r---- libcap.so.2.48
00007f6875d66000       4       4       4 r---- libcap.so.2.48
00007f6875d67000       4       4       4 rw--- libcap.so.2.48
00007f6875d68000     208     128       0 r---- libgnutls.so.30.31.0
00007f6875d9c000    1224      64       0 r-x-- libgnutls.so.30.31.0
00007f6875ece000     348       0       0 r---- libgnutls.so.30.31.0
00007f6875f25000       4       0       0 ----- libgnutls.so.30.31.0
00007f6875f26000      64      64      64 r---- libgnutls.so.30.31.0
00007f6875f36000       8       8       8 rw--- libgnutls.so.30.31.0
00007f6875f38000      12       8       8 rw---   [ anon ]
00007f6875f3b000      48      48       0 r---- libnettle.so.8.4
00007f6875f47000     144       0       0 r-x-- libnettle.so.8.4
00007f6875f6b000      88       0       0 r---- libnettle.so.8.4
00007f6875f81000       4       0       0 ----- libnettle.so.8.4
00007f6875f82000       8       8       8 r---- libnettle.so.8.4
00007f6875f84000       4       4       4 rw--- libnettle.so.8.4
00007f6875f85000      60      60       0 r---- libm.so.6
00007f6875f94000     448     188       0 r-x-- libm.so.6
00007f6876004000     360     120       0 r---- libm.so.6
00007f687605e000       4       4       4 r---- libm.so.6
00007f687605f000       4       4       4 rw--- libm.so.6
00007f6876060000       8       8       8 rw---   [ anon ]
00007f6876066000       8       8       0 r---- ld-linux-x86-64.so.2
00007f6876068000     152     152       0 r-x-- ld-linux-x86-64.so.2
00007f687608e000      44      44       0 r---- ld-linux-x86-64.so.2
00007f687609a000       8       8       8 r---- ld-linux-x86-64.so.2
00007f687609c000       8       8       8 rw--- ld-linux-x86-64.so.2
00007ffc65f71000     132      20      16 rw---   [ stack ]
00007ffc65fbf000      16       0       0 r----   [ anon ]
00007ffc65fc3000       8       4       0 r-x--   [ anon ]
ffffffffff600000       4       0       0 --x--   [ anon ]
---------------- ------- ------- -------
total kB           84088    3948     656
[root@netkiller ~]# ps -e -o 'pid,comm,args,pcpu,rsz,vsz,stime,user,uid' | grep chronyd
  82356 chronyd         /usr/sbin/chronyd -F 2       0.0  3156  84084 Jul30 chrony     991
1361878 grep            grep --color=auto chronyd    0.0  2036   6068 22:31 root         0

ps -e -o 'pid,comm,args,rsz' | grep chronyd
[root@netkiller ~]# ps -e -o 'pid,comm,args,rsz' | grep chronyd
  82356 chronyd         /usr/sbin/chronyd -F 2       3156
1362000 grep            grep --color=auto chronyd    2012
查看 top 10 最占用内存的进程
[root@netkiller ~]# ps aux | sort -k4,4nr | head -n 10
mysql      76365  0.3  2.0 2558560 332992 ?      Ssl  Jul30 326:59 /usr/libexec/mysqld --basedir=/usr
root      327417  0.0  0.6 2344200 100828 ?      Ssl  Sep15   1:53 /usr/bin/dockerd -H fd:// --containerd=/run/containerd/containerd.sock
root         650  0.0  0.4 181592 78064 ?        Ss   Jul29   5:41 /usr/lib/systemd/systemd-journald
root       89542  0.0  0.4 2391868 73348 ?       Ssl  Jul30  45:59 /usr/bin/containerd
root       59454  0.0  0.3 2360036 51412 ?       Ssl  Sep12   0:40 /usr/libexec/snapd/snapd
polkitd      942  0.0  0.1 2983400 21556 ?       Ssl  Jul29   0:01 /usr/lib/polkit-1/polkitd --no-debug
root           1  0.0  0.1 172628 17176 ?        Ss   Jul29  19:55 /usr/lib/systemd/systemd --switched-root --system --deserialize 30
root         764  0.0  0.1 409536 28164 ?        Ssl  Jul29   3:46 /usr/sbin/rsyslogd -n
root         835  0.0  0.1 256840 18456 ?        Ssl  Jul29   0:40 /usr/sbin/NetworkManager --no-daemon
USER         PID %CPU %MEM    VSZ   RSS TTY      STAT START   TIME COMMAND
Command、PID 和 User 列分别表示进程的名称 进程标识符 (PID) 和所有者名称.

FD: 文件描述符,应用程序通过文件描述符识别该文件.如cwd txt等
  (1) cwd : current working directory
      应用程序的当前工作目录,这是该应用程序启动的目录,除非它本身对这个目录进行更改
  (2) txt : program text (code and data)
      该类型的文件是程序代码,如应用程序二进制文件本身或共享库,如上列表中显示的 /sbin/init 程序
  (3) lnn : library references (AIX)
      库引用
  (4) er  : FD information error (see NAME column)
      FD错误信息
  (5) jld : jail directory (FreeBSD)
      安全目录
  (6) ltx : shared library text (code and data)
      共享库文本
  (7) mxx : hex memory-mapped type number xx
      十六进制内存映射型号码xx
  (8) m86 : DOS Merge mapped file
      DOS的合并映射文件
  (9) mem : memory-mapped file
      文件内存映射
 (10) mmap : memory-mapped device
      设备内存映射
 (11) pd  : parent directory
      父目录
 (12) rtd : root directory
      root目录
 (13)  tr : kernel trace file (OpenBSD)
     内核跟踪文件
 (14) v86 : VP/ix mapped file
      VP/ix映射文件

 (15) 0 : 表示标准输出
 (16) 1 : 表示标准输入
 (17) 2 : 表示标准错误
     初始打开每个应用程序时,都具有三个文件描述符,从 0 到 2,分别表示 标准输入 标准输出 和 错误流. 正因为如此,大多数应用程序所打开的文件的 FD 都是从3开始.
     一般在标准输出 标准错误 标准输入 后还跟着文件状态模式: r w u等
  (1) u : 表示该文件被打开并处于读取/写入模式
  (2) r : 表示该文件被打开并处于只读模式
  (3) w : 表示该文件被打开并处于
  (4) 空格 : 表示该文件的状态模式为unknow,且没有锁定
  (5) - : 表示该文件的状态模式为unknow,且被锁定
      同时在文件状态模式后面,还跟着相关的锁
  (1) N : for a Solaris NFS lock of unknown type;
  (2) r : for read lock on part of the file;
  (3) R : for a read lock on the entire file;
  (4) w : for a write lock on part of the file;
          文件的部分写锁
  (5) W : for a write lock on the entire file
          整个文件的写锁
  (6) u : for a read and write lock of any length;
  (7) U : for a lock of unknown type;
  (8) x : for an SCO OpenServer Xenix lock on part of the file;
  (9) X : for an SCO OpenServer Xenix lock on the      entire file;
  (10) space : if there is no lock.

TYPE :  文件类型,与 FD 列相比,Type 列则比较直观.
     根据具体操作系统的不同,您会发现将文件和目录称为REG 和 DIR(在 Solaris 中,称为 VREG 和 VDIR).
     其他可能的取值为 CHR 和 BLK,分别表示字符和块设备;
     或者 UNIX、FIFO 和 IPv4,分别表示 UNIX 域套接字 先进先出 (FIFO) 队列和网际协议 (IP) 套接字.
  (1) DIR : 表示目录
  (2) CHR : 表示字符类型
  (3) BLK : 块设备类型
  (4) UNIX : UNIX 域套接字
  (5) FIFO :先进先出 (FIFO) 队列
  (6) IPv4 :网际协议 (IP) 套接字

Device  SIZE/OFF Node 和 NA
      列涉及到文件本身的信息,分别表示
          指定磁盘的名称
          文件的大小
          索引节点(文件在磁盘上的标识)
          该文件的确切名称
$ sudo lsof -c lighttpd
neo@netkiller:~/workspace/Document$ lsof -p $$
COMMAND  PID USER   FD   TYPE DEVICE SIZE/OFF   NODE NAME
zsh     4536  neo  cwd    DIR    8,6     4096     30 /home/neo/workspace/Document
zsh     4536  neo  rtd    DIR    8,1     4096      2 /
zsh     4536  neo  txt    REG    8,1   675792   6907 /bin/zsh4
zsh     4536  neo  mem    REG    8,1    68824  56594 /usr/lib/zsh/4.3.10/zsh/computil.so
zsh     4536  neo  mem    REG    8,1    41000  30570 /usr/lib/zsh/4.3.10/zsh/parameter.so
zsh     4536  neo  mem    REG    8,1    31512  53350 /usr/lib/zsh/4.3.10/zsh/zutil.so
zsh     4536  neo  mem    REG    8,1   153096  53354 /usr/lib/zsh/4.3.10/zsh/complete.so
zsh     4536  neo  mem    REG    8,1   290888  56596 /usr/lib/zsh/4.3.10/zsh/zle.so
zsh     4536  neo  mem    REG    8,1    10544  30579 /usr/lib/zsh/4.3.10/zsh/terminfo.so
zsh     4536  neo  mem    REG    8,1    51712  19594 /lib/libnss_files-2.11.1.so
zsh     4536  neo  mem    REG    8,1    43552  23798 /lib/libnss_nis-2.11.1.so
zsh     4536  neo  mem    REG    8,1    97256  15503 /lib/libnsl-2.11.1.so
zsh     4536  neo  mem    REG    8,1    35712  16431 /lib/libnss_compat-2.11.1.so
zsh     4536  neo  mem    REG    8,1    18704   1902 /lib/libattr.so.1.1.0
zsh     4536  neo  mem    REG    8,1  1568136   7583 /lib/libc-2.11.1.so
zsh     4536  neo  mem    REG    8,1   534832  11379 /lib/libm-2.11.1.so
zsh     4536  neo  mem    REG    8,1   323640   7295 /lib/libncursesw.so.5.7
zsh     4536  neo  mem    REG    8,1    14696  11378 /lib/libdl-2.11.1.so
zsh     4536  neo  mem    REG    8,1    18888   5099 /lib/libcap.so.2.17
zsh     4536  neo  mem    REG    8,1   136936   7487 /lib/ld-2.11.1.so
zsh     4536  neo  mem    REG    8,1   256324 145156 /usr/lib/locale/en_US.utf8/LC_CTYPE
zsh     4536  neo  mem    REG    8,1       54 131099 /usr/lib/locale/en_US.utf8/LC_NUMERIC
zsh     4536  neo  mem    REG    8,1     2454 145158 /usr/lib/locale/en_US.utf8/LC_TIME
zsh     4536  neo  mem    REG    8,1  1170770 145157 /usr/lib/locale/en_US.utf8/LC_COLLATE
zsh     4536  neo  mem    REG    8,1      286 145159 /usr/lib/locale/en_US.utf8/LC_MONETARY
zsh     4536  neo  mem    REG    8,1       57 145160 /usr/lib/locale/en_US.utf8/LC_MESSAGES/SYS_LC_MESSAGES
zsh     4536  neo  mem    REG    8,1    26048  73711 /usr/lib/gconv/gconv-modules.cache
zsh     4536  neo  mem    REG    8,1       34 131105 /usr/lib/locale/en_US.utf8/LC_PAPER
zsh     4536  neo  mem    REG    8,1       77 131106 /usr/lib/locale/en_US.utf8/LC_NAME
zsh     4536  neo  mem    REG    8,1      155 145161 /usr/lib/locale/en_US.utf8/LC_ADDRESS
zsh     4536  neo  mem    REG    8,1       59 145162 /usr/lib/locale/en_US.utf8/LC_TELEPHONE
zsh     4536  neo  mem    REG    8,1       23 131109 /usr/lib/locale/en_US.utf8/LC_MEASUREMENT
zsh     4536  neo  mem    REG    8,1      373 145163 /usr/lib/locale/en_US.utf8/LC_IDENTIFICATION
zsh     4536  neo    0u   CHR  136,0      0t0      3 /dev/pts/0
zsh     4536  neo    1u   CHR  136,0      0t0      3 /dev/pts/0
zsh     4536  neo    2u   CHR  136,0      0t0      3 /dev/pts/0
zsh     4536  neo   10u   CHR  136,0      0t0      3 /dev/pts/0
谁打开了该文件? 显示打开文件filename的进程
lsof filename
列出某个目录下被打开的文件
# lsof /tmp/
COMMAND    PID USER   FD   TYPE DEVICE SIZE/OFF    NODE NAME
seahorse- 4158  neo  cwd    DIR    8,2    53248 1310721 /tmp
递归子目录列出文件状态
$ sudo lsof +D /srv/
COMMAND  PID USER  FD   TYPE DEVICE SIZE/OFF    NODE NAME
match   5227 root txt    REG  252,0  1351616 1966083 /srv/match

[root@netkiller ~]# lsof +D /proc/1/
COMMAND PID USER   FD   TYPE DEVICE SIZE/OFF NODE NAME
systemd   1 root    9r   REG    0,3        0 8401 /proc/1/mountinfo
>1 查看某个文件被哪个进程/命令正在使用


在一个窗口执行
[root@netkiller ~]# less /etc/passwd
在另外一个窗口执行
[root@netkiller ~]# lsof /etc/passwd
COMMAND   PID USER   FD   TYPE DEVICE SIZE/OFF    NODE NAME
less    14493 root    4r   REG    8,2     2676 4466070 /etc/passwd

递归查看某个目录中文件被哪些命令/程序使用
    使用了+D,对应目录下的所有子目录和文件都会被列出
开两个窗口分别执行如下命令
[root@netkiller ~]# less test/logs/access/2013-05-22.access
[root@netkiller ~]# less test/11
再第三个窗口执行
[root@netkiller ~]# lsof +D test/
COMMAND   PID USER   FD   TYPE DEVICE SIZE/OFF    NODE NAME
less    14840 root    4r   REG    8,2      252 6166856 test/11
less    14877 root    4r   REG    8,2        0 6166852 test/logs/access/2013-05-22.access
$ lsof /dev/tty1
COMMAND   PID USER   FD   TYPE DEVICE SIZE/OFF NODE NAME
bash    17187  neo    0u   CHR    4,1      0t0 1057 /dev/tty1
bash    17187  neo    1u   CHR    4,1      0t0 1057 /dev/tty1
bash    17187  neo    2u   CHR    4,1      0t0 1057 /dev/tty1
bash    17187  neo  255u   CHR    4,1      0t0 1057 /dev/tty1
用户显示打开的文件
# lsof -u apache |more
COMMAND  PID   USER   FD   TYPE DEVICE SIZE/OFF   NODE NAME
httpd   4374 apache  cwd    DIR  252,1     4096      2 /
httpd   4374 apache  rtd    DIR  252,1     4096      2 /
httpd   4374 apache  txt    REG  252,1   354816 408099 /usr/sbin/httpd
httpd   4374 apache  mem    REG  252,1     9488 408013 /usr/lib64/apr-util-1/apr_ldap-1.so
httpd   4374 apache  mem    REG  252,1    27424    907 /lib64/libnss_dns-2.12.so
httpd   4374 apache  mem    REG  252,1    65928    909 /lib64/libnss_files-2.12.so
httpd   4374 apache  mem    REG  252,1    10416 408095 /usr/lib64/httpd/modules/mod_version.so
httpd   4374 apache  mem    REG  252,1    27312 408054 /usr/lib64/httpd/modules/mod_cgi.so
httpd   4374 apache  mem    REG  252,1    22992 408061 /usr/lib64/httpd/modules/mod_disk_cache.so

[root@netkiller ~]# lsof -u www
COMMAND  PID USER   FD   TYPE             DEVICE SIZE/OFF     NODE NAME
httpd   2412  www  DEL    REG                0,4             12653 /dev/zero
httpd   2412  www  mem    REG                8,2    90784  5636110 /lib64/libgcc_s-4.4.7-20120601.so.1
列出被打开的文件信息,排除root用户
[root@netkiller neo]# lsof -u ^root |more

COMMAND     PID   TID          USER   FD      TYPE             DEVICE   SIZE/OFF      NODE NAME
dbus-daem   448                dbus  cwd       DIR              253,1       4096         2 /
dbus-daem   448                dbus  rtd       DIR              253,1       4096         2 /
dbus-daem   448                dbus  txt       REG              253,1     441256    141406 /usr/bin/dbus-daemon;56822cb8 (deleted)
dbus-daem   448                dbus  DEL       REG              253,1               146439 /usr/lib64/libnss_sss.so.2;56822cb8
dbus-daem   448                dbus  DEL       REG              253,1               151203 /usr/lib64/libnss_files-2.17.so;56822cb8
dbus-daem   448                dbus  DEL       REG              253,1               151199 /usr/lib64/libdl-2.17.so;56822cb8
dbus-daem   448                dbus  DEL       REG              253,1               133002 /usr/lib64/liblzma.so.5.0.99;56822ac0
dbus-daem   448                dbus  DEL       REG              253,1               133005 /usr/lib64/libpcre.so.1.2.0;56822ac0
dbus-daem   448                dbus  DEL       REG              253,1               132825 /usr/lib64/libc-2.17.so;56822cb8
dbus-daem   448                dbus  DEL       REG              253,1               151206 /usr/lib64/librt-2.17.so;56822cb8
dbus-daem   448                dbus  DEL       REG              253,1               132851 /usr/lib64/libpthread-2.17.so;56822cb8
dbus-daem   448                dbus  DEL       REG              253,1               133622 /usr/lib64/libcap-ng.so.0.0.0;56822cb8
dbus-daem   448                dbus  mem       REG              253,1     118792    133084 /usr/lib64/libaudit.so.1.0.0
dbus-daem   448                dbus  mem       REG              253,1     147120    133015 /usr/lib64/libselinux.so.1
dbus-daem   448                dbus  mem       REG              253,1     173288    133153 /usr/lib64/libexpat.so.1.6.0
dbus-daem   448                dbus  DEL       REG              253,1               132818 /usr/lib64/ld-2.17.so;56822cb8
dbus-daem   448                dbus    0r      CHR                1,3        0t0      1028 /dev/null
dbus-daem   448                dbus    1u     unix 0xffff880426d4c740        0t0     14381 socket
dbus-daem   448                dbus    2u     unix 0xffff880426d4c740        0t0     14381 socket
dbus-daem   448                dbus    3u     unix 0xffff880428cd7800        0t0     14082 /var/run/dbus/system_bus_socket
dbus-daem   448                dbus    4u  a_inode                0,9          0      5639 [eventpoll]
dbus-daem   448                dbus    5r  a_inode                0,9          0      5639 inotify
dbus-daem   448                dbus    6u     sock                0,6        0t0     14179 protocol: NETLINK
dbus-daem   448                dbus    7u     unix 0xffff880428cd1e00        0t0     14180 socket
dbus-daem   448                dbus    8u     unix 0xffff880428cd5640        0t0     14181 socket
dbus-daem   448                dbus    9u     unix 0xffff880037101e00        0t0   5347943 /var/run/dbus/system_bus_socket
dbus-daem   448                dbus   10u     unix 0xffff8800292ae900        0t0 626418112 /var/run/dbus/system_bus_socket
dbus-daem   448                dbus   11u     unix 0xffff880426f3cec0        0t0   5345962 socket
dbus-daem   448                dbus   12u     unix 0xffff8801f8149e00        0t0 626420423 /var/run/dbus/system_bus_socket


[root@netkiller ~]# lsof -u ^www
COMMAND     PID      USER   FD      TYPE             DEVICE  SIZE/OFF       NODE NAME
init          1      root  txt       REG                8,2    150352    2228260 /sbin/init
init          1      root  mem       REG                8,2     65928    5636192 /lib64/libnss_files-2.12.so
组监控
[root@netkiller neo]# lsof -g 0
COMMAND     PID PGID USER   FD      TYPE DEVICE SIZE/OFF NODE NAME
kthreadd      2    0 root  cwd       DIR  202,1     4096    2 /
kthreadd      2    0 root  rtd       DIR  202,1     4096    2 /
kthreadd      2    0 root  txt   unknown                      /proc/2/exe
ksoftirqd     3    0 root  cwd       DIR  202,1     4096    2 /
ksoftirqd     3    0 root  rtd       DIR  202,1     4096    2 /
ksoftirqd     3    0 root  txt   unknown                      /proc/3/exe
kworker/0     5    0 root  cwd       DIR  202,1     4096    2 /
kworker/0     5    0 root  rtd       DIR  202,1     4096    2 /
kworker/0     5    0 root  txt   unknown                      /proc/5/exe
migration     7    0 root  cwd       DIR  202,1     4096    2 /
migration     7    0 root  rtd       DIR  202,1     4096    2 /
migration     7    0 root  txt   unknown                      /proc/7/exe
列出某个程序进程所打开的文件信息,显示httpd进程现在打开的文件
lsof -c httpd
显示多个进程命令用法
[root@netkiller ~]# lsof -c smbd
COMMAND  PID USER   FD   TYPE             DEVICE SIZE/OFF    NODE NAME
smbd    2506 root  cwd    DIR                8,2     4096       2 /
smbd    2506 root  rtd    DIR                8,2     4096       2 /
smbd    2506 root  txt    REG                8,2 10112200 3935771 /usr/sbin/smbd

[root@netkiller ~]# lsof -c smbd -c httpd
-p 进程ID, 显示该进程打开了那些文件
pgrep httpd
lsof -p 1782
显示进程ID
# lsof -t -u apache
4374
4375
4376
4377
4378
4379
4380

列出某个程序号打开的文件

[root@netkiller ~]# lsof -p 2374
COMMAND  PID USER   FD   TYPE DEVICE SIZE/OFF    NODE NAME
httpd   2374 root  cwd    DIR    8,2     4096       2 /
httpd   2374 root  rtd    DIR    8,2     4096       2 /
httpd   2374 root  txt    REG    8,2  1772950 4985314 /usr/local/apache/bin/httpd
httpd   2374 root  DEL    REG    0,4            12653 /dev/zero
httpd   2374 root  mem    REG    8,2    90784 5636110 /lib64/libgcc_s-4.4.7-20120601.so.1
监控多个进程ID
[root@netkiller neo]# lsof -p 20535,26359,31462 | more
COMMAND   PID    USER   FD   TYPE             DEVICE   SIZE/OFF      NODE NAME
nginx   20535    root  cwd    DIR              253,1       4096         2 /
nginx   20535    root  rtd    DIR              253,1       4096         2 /
nginx   20535    root  txt    REG              253,1    1066704    142069 /usr/sbin/nginx
nginx   20535    root  DEL    REG                0,4            686393039 /dev/zero
nginx   20535    root  mem    REG              253,1      61928    162109 /usr/lib64/libnss_files-2.17.so
nginx   20535    root  mem    REG              253,1     153192    151546 /usr/lib64/liblzma.so.5.0.99
nginx   20535    root  mem    REG              253,1     147120    133015 /usr/lib64/libselinux.so.1
nginx   20535    root  mem    REG              253,1     110808    162113 /usr/lib64/libresolv-2.17.so
nginx   20535    root  mem    REG              253,1      15688    134676 /usr/lib64/libkeyutils.so.1.5
nginx   20535    root  mem    REG              253,1      62720    158030 /usr/lib64/libkrb5support.so.0.1
nginx   20535    root  mem    REG              253,1     202576    137049 /usr/lib64/libk5crypto.so.3.1
nginx   20535    root  mem    REG              253,1      15840    133029 /usr/lib64/libcom_err.so.2.1
nginx   20535    root  mem    REG              253,1     950496    137059 /usr/lib64/libkrb5.so.3.3
nginx   20535    root  mem    REG              253,1     316528    151679 /usr/lib64/libgssapi_krb5.so.2.2
nginx   20535    root  mem    REG              253,1      11376    151527 /usr/lib64/libfreebl3.so
nginx   20535    root  mem    REG              253,1    2112384    132823 /usr/lib64/libc-2.17.so
nginx   20535    root  mem    REG              253,1      90632    133017 /usr/lib64/libz.so.1.2.7
nginx   20535    root  mem    REG              253,1    2016880    132882 /usr/lib64/libcrypto.so.1.0.1e
nginx   20535    root  mem    REG              253,1     449904    137215 /usr/lib64/libssl.so.1.0.1e
nginx   20535    root  mem    REG              253,1     398264    160788 /usr/lib64/libpcre.so.1.2.0
nginx   20535    root  mem    REG              253,1      40816    151198 /usr/lib64/libcrypt-2.17.so
nginx   20535    root  mem    REG              253,1     142304    132849 /usr/lib64/libpthread-2.17.so
nginx   20535    root  mem    REG              253,1      19520    162101 /usr/lib64/libdl-2.17.so
nginx   20535    root  mem    REG              253,1     164440    132816 /usr/lib64/ld-2.17.so
nginx   20535    root  DEL    REG                0,4            686393042 /dev/zero
nginx   20535    root    0u   CHR                1,3        0t0      1028 /dev/null
nginx   20535    root    1u   CHR                1,3        0t0      1028 /dev/null
排除1,4,显示2,3,5
[root@netkiller neo]# lsof -p ^1,2,3,^4,5
COMMAND   PID USER   FD      TYPE DEVICE SIZE/OFF NODE NAME
kthreadd    2 root  cwd       DIR  253,1     4096    2 /
kthreadd    2 root  rtd       DIR  253,1     4096    2 /
kthreadd    2 root  txt   unknown                      /proc/2/exe
ksoftirqd   3 root  cwd       DIR  253,1     4096    2 /
ksoftirqd   3 root  rtd       DIR  253,1     4096    2 /
ksoftirqd   3 root  txt   unknown                      /proc/3/exe
kworker/0   5 root  cwd       DIR  253,1     4096    2 /
kworker/0   5 root  rtd       DIR  253,1     4096    2 /
kworker/0   5 root  txt   unknown                      /proc/5/exe
列出所有的网络连接
[root@netkiller neo]# lsof -i
COMMAND     PID          USER   FD   TYPE    DEVICE SIZE/OFF NODE NAME
php-fpm    2274           www    0u  IPv4  96056019      0t0  TCP localhost:cslistener (LISTEN)
php-fpm    2274           www    4u  IPv4 688391009      0t0  TCP localhost:43483->localhost:27017 (ESTABLISHED)
python3    4384        zabbix    6u  IPv4 688769849      0t0  TCP iZ623qr3xctZ:zabbix-agent->10.26.6.18:50666 (ESTABLISHED)
python3    4385        zabbix    6u  IPv4 688769848      0t0  TCP iZ623qr3xctZ:zabbix-agent->10.26.6.18:50668 (ESTABLISHED)
redis-ser  5170         redis    4u  IPv4   5690059      0t0  TCP localhost:6379 (LISTEN)
php-fpm    8277           www    0u  IPv4  96056019      0t0  TCP localhost:cslistener (LISTEN)
php-fpm    8277           www    4u  IPv4 688149893      0t0  TCP localhost:60933->localhost:27017 (ESTABLISHED)
php-fpm    8543           www    0u  IPv4  96056019      0t0  TCP localhost:cslistener (LISTEN)
beam.smp   9703      rabbitmq    8u  IPv4 626401894      0t0  TCP *:25672 (LISTEN)
beam.smp   9703      rabbitmq    9u  IPv4 626401896      0t0  TCP localhost:42821->localhost:epmd (ESTABLISHED)
beam.smp   9703      rabbitmq   17u  IPv6 626403609      0t0  TCP *:amqp (LISTEN)
beam.smp   9703      rabbitmq   18u  IPv4 626402643      0t0  TCP *:15672 (LISTEN)
beam.smp   9703      rabbitmq   20u  IPv6 685257290      0t0  TCP localhost:amqp->localhost:57692 (ESTABLISHED)
sshd      11227          root    3u  IPv4 626404210      0t0  TCP *:ssh (LISTEN)
ntpd      11646           ntp   16u  IPv4 626409506      0t0  UDP *:ntp
ntpd      11646           ntp   17u  IPv6 626406239      0t0  UDP *:ntp
ntpd      11646           ntp   18u  IPv4 626406244      0t0  UDP localhost:ntp
ntpd      11646           ntp   19u  IPv4 626406245      0t0  UDP iZ623qr3xctZ:ntp
ntpd      11646           ntp   20u  IPv4 626406246      0t0  UDP iZ623qr3xctZ:ntp


5 列出所有的网络连接/端口


[root@netkiller ~]# lsof -i
COMMAND     PID   USER   FD   TYPE   DEVICE SIZE/OFF NODE NAME
portreser  1698   root    5u  IPv4    10656      0t0  UDP *:ldaps
snmpd      1993   root    7u  IPv4    12071      0t0  UDP *:snmp
snmpd      1993   root    9u  IPv4    12073      0t0  TCP localhost:smux (LISTEN)
sshd       2005   root    3u  IPv4    12109      0t0  TCP *:ssh (LISTEN)
什么程序运行在22端口上
lsof -i :22
谁在联系端口
# lsof -i -a -c ssh
COMMAND  PID USER   FD   TYPE DEVICE SIZE/OFF NODE NAME
sshd    2843 root    3r  IPv4  27960      0t0  TCP 192.168.6.9:ssh->192.168.6.30:55363 (ESTABLISHED)
sshd    3003 root    3u  IPv4  28864      0t0  TCP *:ssh (LISTEN)
sshd    3003 root    4u  IPv6  28866      0t0  TCP *:ssh (LISTEN)
$ lsof -i -a -c nginx
COMMAND   PID USER   FD   TYPE    DEVICE SIZE/OFF NODE NAME
nginx   26222  www    8w  IPv4 557827648      0t0  TCP 42.121.14.230:http->110.240.206.67:63482 (ESTABLISHED)
nginx   26222  www    9u  IPv4 557817283      0t0  TCP 42.121.14.230:http->27.106.154.202:18972 (ESTABLISHED)
nginx   26222  www   10u  IPv4 496452301      0t0  TCP *:http (LISTEN)
nginx   26222  www   17u  IPv4 557826020      0t0  TCP 42.121.14.230:http->210.177.78.33:62297 (ESTABLISHED)
nginx   26222  www   18u  IPv4 557827745      0t0  TCP 42.121.14.230:http->115.214.39.230:50628 (ESTABLISHED)
nginx   26222  www   19u  IPv4 557826475      0t0  TCP 42.121.14.230:http->183.160.124.225:57143 (ESTABLISHED)
nginx   26222  www   20u  IPv4 557827670      0t0  TCP 42.121.14.230:http->125.88.77.30:8956 (ESTABLISHED)
nginx   26222  www   21u  IPv4 557826122      0t0  TCP 42.121.14.230:http->116.24.229.173:rfid-rp1 (ESTABLISHED)
nginx   26222  www   22u  IPv4 557826127      0t0  TCP 42.121.14.230:http->119.137.141.76:21508 (ESTABLISHED)
nginx   26222  www   23u  IPv4 557826476      0t0  TCP 42.121.14.230:http->183.160.124.225:57144 (ESTABLISHED)
nginx   26222  www   24u  IPv4 557821930      0t0  TCP 42.121.14.230:http->210.21.127.136:52309 (ESTABLISHED)
nginx   26222  www   25u  IPv4 557826477      0t0  TCP 42.121.14.230:http->183.160.124.225:57145 (ESTABLISHED)
nginx   26222  www   26u  IPv4 557827693      0t0  TCP 42.121.14.230:http->111.227.215.135:18628 (ESTABLISHED)
通过进程ID监控网络连接
$ lsof -i -a -p 26222
COMMAND   PID USER   FD   TYPE    DEVICE SIZE/OFF NODE NAME
nginx   26222  www    8w  IPv4 557827648      0t0  TCP 42.121.14.230:http->110.240.206.67:63482 (ESTABLISHED)
nginx   26222  www    9u  IPv4 557817283      0t0  TCP 42.121.14.230:http->27.106.154.202:18972 (ESTABLISHED)
nginx   26222  www   10u  IPv4 496452301      0t0  TCP *:http (LISTEN)
nginx   26222  www   21u  IPv4 557826122      0t0  TCP 42.121.14.230:http->116.24.229.173:rfid-rp1 (ESTABLISHED)
nginx   26222  www   26u  IPv4 557827693      0t0  TCP 42.121.14.230:http->111.227.215.135:18628 (ESTABLISHED)
nginx   26222  www   31u  IPv4 557798349      0t0  TCP 42.121.14.230:http->213.92.156.27.broad.fz.fj.dynamic.163data.com.cn:novation (ESTABLISHED)
nginx   26222  www   33u  IPv4 557807306      0t0  TCP 42.121.14.230:http->182.139.49.102:news (ESTABLISHED)
nginx   26222  www   38u  IPv4 557825270      0t0  TCP 42.121.14.230:http->122.71.50.188:43694 (ESTABLISHED)
nginx   26222  www   40u  IPv4 557817907      0t0  TCP 42.121.14.230:http->120.28.127.54:62009 (ESTABLISHED)
nginx   26222  www   41u  IPv4 557800691      0t0  TCP 42.121.14.230:http->27.190.185.75:60475 (ESTABLISHED)
UDP 监控
# lsof -i udp;
COMMAND    PID     USER   FD   TYPE   DEVICE SIZE/OFF NODE NAME
rpcbind   2431      rpc    6u  IPv4    12483      0t0  UDP *:sunrpc
rpcbind   2431      rpc    7u  IPv4    12487      0t0  UDP *:kink
rpcbind   2431      rpc    9u  IPv6    12490      0t0  UDP *:sunrpc
rpcbind   2431      rpc   10u  IPv6    12492      0t0  UDP *:kink
avahi-dae 2549    avahi   13u  IPv4    12781      0t0  UDP *:mdns
avahi-dae 2549    avahi   14u  IPv4    12782      0t0  UDP *:45747
rpc.statd 2570  rpcuser    5u  IPv4    13011      0t0  UDP *:asia
rpc.statd 2570  rpcuser    8u  IPv4    13015      0t0  UDP *:55218
rpc.statd 2570  rpcuser   10u  IPv6    13023      0t0  UDP *:51236
openvpn   2594   nobody    5u  IPv4    13060      0t0  UDP *:openvpn
cupsd     2661     root    9u  IPv4    13379      0t0  UDP *:ipp
ntpd      2832      ntp   16u  IPv4    14050      0t0  UDP *:ntp
ntpd      2832      ntp   17u  IPv6    14051      0t0  UDP *:ntp
ntpd      2832      ntp   18u  IPv6    14055      0t0  UDP localhost:ntp
ntpd      2832      ntp   19u  IPv6    14056      0t0  UDP [fe80::225:90ff:fe35:906c]:ntp
ntpd      2832      ntp   20u  IPv4    14057      0t0  UDP localhost:ntp
ntpd      2832      ntp   21u  IPv4    14058      0t0  UDP manager.repo:ntp
ntpd      2832      ntp   22u  IPv4    14059      0t0  UDP 10.8.0.1:ntp
ntpd      2832      ntp   24u  IPv4    15922      0t0  UDP 192.168.122.1:ntp
ntpd      2832      ntp   25u  IPv6    27224      0t0  UDP [fe80::fc54:ff:fe94:b3c2]:ntp
ntpd      2832      ntp   26u  IPv6    27225      0t0  UDP [fe80::fc54:ff:fe54:c9d2]:ntp
ntpd      2832      ntp   27u  IPv6    27948      0t0  UDP [fe80::fc54:ff:fe4e:a846]:ntp
ntpd      2832      ntp   28u  IPv6    28197      0t0  UDP [fe80::fc54:ff:fe19:c00e]:ntp
ntpd      2832      ntp   29u  IPv6 99178415      0t0  UDP [fe80::fc54:ff:fe5a:ace]:ntp
ntpd      2832      ntp   30u  IPv6 99179648      0t0  UDP [fe80::fc54:ff:fe68:54a0]:ntp
ntpd      2832      ntp   31u  IPv6 99180801      0t0  UDP [fe80::fc54:ff:fed6:3593]:ntp
postmaste 3391 postgres    9u  IPv6    15004      0t0  UDP localhost:56631->localhost:56631
postmaste 3395 postgres    9u  IPv6    15004      0t0  UDP localhost:56631->localhost:56631
postmaste 3396 postgres    9u  IPv6    15004      0t0  UDP localhost:56631->localhost:56631
postmaste 3397 postgres    9u  IPv6    15004      0t0  UDP localhost:56631->localhost:56631
postmaste 3398 postgres    9u  IPv6    15004      0t0  UDP localhost:56631->localhost:56631
postmaste 3399 postgres    9u  IPv6    15004      0t0  UDP localhost:56631->localhost:56631
dnsmasq   3647   nobody    5u  IPv4    15671      0t0  UDP *:bootps
dnsmasq   3647   nobody    7u  IPv4    15680      0t0  UDP 192.168.122.1:domain
TCP 监控
lsof -i tcp;
特定的tcp/udp端口, 监控 udp 端口 123
[root@netkiller neo]# lsof -i udp:123
COMMAND   PID USER   FD   TYPE    DEVICE SIZE/OFF NODE NAME
ntpd    11646  ntp   16u  IPv4 626409506      0t0  UDP *:ntp
ntpd    11646  ntp   17u  IPv6 626406239      0t0  UDP *:ntp
ntpd    11646  ntp   18u  IPv4 626406244      0t0  UDP localhost:ntp
ntpd    11646  ntp   19u  IPv4 626406245      0t0  UDP iZ623qr3xctZ:ntp
ntpd    11646  ntp   20u  IPv4 626406246      0t0  UDP iZ623qr3xctZ:ntp

检测某个端口所占用的进程,如22端口
[root@netkiller ~]# lsof -i :22

[root@netkiller ~]# lsof -i udp:53
列出所有tcp/UDP 网络连接信息
[root@netkiller ~]# lsof -i tcp/udp
列出nginx用户活跃的链接
[root@netkiller neo]# lsof  -a -u nginx -i
COMMAND   PID  USER   FD   TYPE    DEVICE SIZE/OFF NODE NAME
nginx   20536 nginx   19u  IPv4 686393040      0t0  TCP *:http (LISTEN)
nginx   20536 nginx   20u  IPv4 686393041      0t0  TCP *:https (LISTEN)
nginx   20536 nginx   42u  IPv4 688774445      0t0  TCP iZ623qr3xctZ:http->112.224.19.79:32751 (ESTABLISHED)
nginx   20536 nginx   49u  IPv4 688774400      0t0  TCP iZ623qr3xctZ:http->117.156.4.113:58212 (ESTABLISHED)
nginx   20536 nginx   52u  IPv4 688774494      0t0  TCP iZ623qr3xctZ:http->112.224.19.79:32753 (ESTABLISHED)
nginx   20536 nginx   53u  IPv4 688774495      0t0  TCP iZ623qr3xctZ:http->112.224.19.79:32752 (ESTABLISHED)
nginx   20536 nginx   54u  IPv4 688774555      0t0  TCP iZ623qr3xctZ:http->113.128.232.89:37529 (ESTABLISHED)
nginx   20536 nginx   55u  IPv4 688774497      0t0  TCP iZ623qr3xctZ:http->112.224.19.79:32754 (ESTABLISHED)
nginx   20536 nginx   56u  IPv4 688774556      0t0  TCP iZ623qr3xctZ:http->113.128.232.89:37530 (ESTABLISHED)
nginx   20536 nginx   58u  IPv4 688774500      0t0  TCP iZ623qr3xctZ:http->112.224.19.79:32755 (ESTABLISHED)
nginx   20536 nginx   60u  IPv4 688778242      0t0  TCP iZ623qr3xctZ:http->113.128.232.89:37532 (ESTABLISHED)
nginx   20536 nginx   61u  IPv4 688774559      0t0  TCP iZ623qr3xctZ:http->113.128.232.89:37528 (ESTABLISHED)
nginx   20536 nginx   64u  IPv4 688774562      0t0  TCP iZ623qr3xctZ:http->113.128.232.89:37531 (ESTABLISHED)
nginx   20537 nginx   19u  IPv4 686393040      0t0  TCP *:http (LISTEN)
nginx   20537 nginx   20u  IPv4 686393041      0t0  TCP *:https (LISTEN)
nginx   20538 nginx   19u  IPv4 686393040      0t0  TCP *:http (LISTEN)
nginx   20538 nginx   20u  IPv4 686393041      0t0  TCP *:https (LISTEN)
nginx   20539 nginx   18u  IPv4 688777804      0t0  TCP iZ623qr3xctZ:http->39.187.213.246:49624 (ESTABLISHED)
nginx   20539 nginx   19u  IPv4 686393040      0t0  TCP *:http (LISTEN)
nginx   20539 nginx   20u  IPv4 686393041      0t0  TCP *:https (LISTEN)
组合参数
# lsof -a -c bash -u root
COMMAND  PID USER   FD   TYPE DEVICE SIZE/OFF    NODE NAME
bash    1394 root  cwd    DIR    8,2     4096 4849665 /root
bash    1394 root  rtd    DIR    8,2     4096       2 /
bash    1394 root  txt    REG    8,2   938768 3671557 /bin/bash
bash    1394 root  mem    REG    8,2   156872 3014902 /lib64/ld-2.12.so
bash    1394 root  mem    REG    8,2  1922152 3014903 /lib64/libc-2.12.so
bash    1394 root  mem    REG    8,2    22536 3014911 /lib64/libdl-2.12.so
bash    1394 root  mem    REG    8,2   138280 3018719 /lib64/libtinfo.so.5.7
bash    1394 root  mem    REG    8,2    65928 3017998 /lib64/libnss_files-2.12.so
bash    1394 root  mem    REG    8,2    26060 2632051 /usr/lib64/gconv/gconv-modules.cache
bash    1394 root  mem    REG    8,2 99158576 2648204 /usr/lib/locale/locale-archive
bash    1394 root    0u   CHR  136,7      0t0      10 /dev/pts/7
bash    1394 root    1u   CHR  136,7      0t0      10 /dev/pts/7
bash    1394 root    2u   CHR  136,7      0t0      10 /dev/pts/7
bash    1394 root  255u   CHR  136,7      0t0      10 /dev/pts/7
每个5秒刷新一次
# lsof -c init -a -r5
列出www用户的所有活跃的网络端口
[root@netkiller ~]# lsof -a -u www -i

列出被sshd进程所打开的所有IPV4网络相关文件
[root@netkiller ~]# lsof -i 4 -c sshd  -a

列出被root用户所打开的所有TCP和IPV4网络相关文件
[root@netkiller ~]# lsof -i 4 -i tcp  -u root -a
lsof -d  fd_type

[root@netkiller ~]# lsof -d 2
COMMAND     PID      USER   FD   TYPE DEVICE SIZE/OFF    NODE NAME
init          1      root    2u   CHR    1,3      0t0    3794 /dev/null

根据文件描述范围列出文件信息
[root@netkiller ~]# lsof -d 2-4
COMMAND     PID      USER   FD   TYPE             DEVICE  SIZE/OFF       NODE NAME
init          1      root    2u   CHR                1,3       0t0       3794 /dev/null

列出COMMAND列中包含字符串" httpd",且文件描符的类型为txt的文件信息
[root@netkiller ~]# lsof -c httpd -a -d txt
COMMAND  PID USER  FD   TYPE DEVICE SIZE/OFF    NODE NAME
httpd   2374 root txt    REG    8,2  1772950 4985314 /usr/local/apache/bin/httpd
$ sudo apt-get install sysstat
iostat
$ iostat
Linux 2.6.24-21-generic (netkiller)     Thursday, December 04, 2008

avg-cpu:  %user   %nice %system %iowait  %steal   %idle
           0.57    0.03    0.14    0.41    0.00   98.85

Device:            tps   Blk_read/s   Blk_wrtn/s   Blk_read   Blk_wrtn
sda               6.45       132.69        68.33     595116     306456
sda1              0.00         0.00         0.00       1606         58
sda2              0.00         0.00         0.00        820          0
sda3              2.20         1.16        17.27    1502618   22448752
sudo iostat -x 2
# iostat -x 1
avg-cpu: %user %nice %sys %idle
2.04 0.00 97.96 0.00
Device: rrqm/s wrqm/s r/s w/s rsec/s wsec/s rkB/s wkB/s avgrq-sz avgqu-sz await svctm %util
/dev/sda 0.00 633.67 3.06 102.31 24.49 5281.63 12.24 2640.82 288.89 73.67 113.89 27.22 50.00

从输出我们看到w/s=102,wKB/s=2640.所以2640/102=23KB per I/O.

因此对于连续I/O系统来说我们要关注系统读取大量数据的能力即KB per request.对于随机I/O系统我们注重IOPS值.
netstat 监控TCP状态
netstat -n | awk '/^tcp/ {++S[$NF]} END {for(a in S) print a, S[a]}'
状态:		描述
CLOSED:		无连接是活动的或正在进行
LISTEN:		服务器在等待进入呼叫
SYN_RECV:	一个连接请求已经到达,等待确认
SYN_SENT:	应用已经开始,打开一个连接
ESTABLISHED:正常数据传输状态
FIN_WAIT1:	应用说它已经完成
FIN_WAIT2:	另一边已同意释放
ITMED_WAIT:等待所有分组死掉
CLOSING:	两边同时尝试关闭
TIME_WAIT:	另一边已初始化一个释放
LAST_ACK:	等待所有分组死掉
# ss
State      Recv-Q Send-Q      Local Address:Port          Peer Address:Port
CLOSE-WAIT 1      0           192.168.3.124:19644       130.75.116.209:http
CLOSE-WAIT 1      0           192.168.3.124:31289       170.224.194.69:https
CLOSE-WAIT 1      0           192.168.3.124:64903         198.20.8.241:https
CLOSE-WAIT 1      0           192.168.3.124:64902         198.20.8.241:https
CLOSE-WAIT 1      0           192.168.3.124:27528      170.224.160.205:https
CLOSE-WAIT 1      0           192.168.3.124:10152         198.20.8.241:https
CLOSE-WAIT 1      0           192.168.3.124:18263       170.224.194.69:http
CLOSE-WAIT 1      0           192.168.3.124:18262       170.224.194.69:http
CLOSE-WAIT 1      0           192.168.3.124:27792         129.89.61.70:http
CLOSE-WAIT 1      0           192.168.3.124:27595         129.89.61.70:http
CLOSE-WAIT 1      0           192.168.3.124:28970         129.89.61.70:http
CLOSE-WAIT 1      0           192.168.3.124:28158       130.75.116.210:http
CLOSE-WAIT 1      0           192.168.3.124:26186       130.75.116.210:http
CLOSE-WAIT 1      0           192.168.3.124:26185       130.75.116.210:http
CLOSE-WAIT 1      0           192.168.3.124:42563         74.125.71.99:http
CLOSE-WAIT 1      0           192.168.3.124:42564         74.125.71.99:http
CLOSE-WAIT 1      0           192.168.3.124:63459       130.75.116.202:http
CLOSE-WAIT 1      0           192.168.3.124:63458       130.75.116.202:http
ESTAB      0      0           192.168.3.124:30829         192.168.3.17:3260
ESTAB      0      0           192.168.3.124:13234         192.168.3.15:3260
ESTAB      0      0        ::ffff:192.168.3.124:ssh        ::ffff:192.168.80.5:5                                                                                        2682
ESTAB      0      1960     ::ffff:192.168.3.124:ssh        ::ffff:192.168.80.5:5                                                                                        2957


$ ss
State      Recv-Q Send-Q                Local Address:Port                    Peer Address:Port
ESTAB      0      0                      192.168.80.1:38281                     64.4.61.72:1863
ESTAB      0      0                      192.168.80.1:54504                  112.95.240.77:8000
ESTAB      0      0                      192.168.80.1:14698                  74.125.71.125:5222
ESTAB      0      0                      192.168.80.1:14697                  74.125.71.125:5222
ESTAB      0      0                      192.168.80.1:54123                   64.12.28.171:https
ESTAB      0      0                      192.168.80.1:4225                     64.4.61.171:1863
ESTAB      0      0                      192.168.80.1:ssh                     192.168.80.5:51291
ESTAB      0      0               ::ffff:192.168.80.1:microsoft-ds          ::ffff:192.168.80.5:51094
ESTAB      0      0                      192.168.80.1:22074                  205.188.1.241:https
ESTAB      0      0                      192.168.80.1:59340                    64.4.34.213:1863
ESTAB      0      0                      192.168.80.1:9766                   91.189.89.114:https
ESTAB      0      0                      192.168.80.1:3300                      64.4.44.78:1863
root@netkiller ~ % ss -itn
State                    Recv-Q                     Send-Q                                            Local Address:Port                                           Peer Address:Port
ESTAB                    0                          0                                                  192.168.3.14:22                                              192.168.3.4:63044
	 cubic wscale:6,7 rto:212 rtt:10.681/8.769 ato:40 mss:1448 pmtu:1500 rcvmss:1392 advmss:1448 cwnd:10 ssthresh:16 bytes_acked:33428 bytes_received:9337 segs_out:377 segs_in:522 data_segs_out:360 data_segs_in:160 send 10.8Mbps lastsnd:68 lastrcv:72 lastack:56 pacing_rate 13.0Mbps delivery_rate 20.8Mbps app_limited busy:668ms rcv_rtt:7 rcv_space:28960 rcv_ssthresh:45776 minrtt:1.302
CentOS
# yum install nload -y
Ubuntu
# sudo apt-get install nload
运行监控命令
# nload
Device eth0 [172.16.3.90] (1/5):
=============================================================================
Incoming:

                                                     Curr: 10.00 kBit/s
                                                     Avg: 103.95 kBit/s
                                                     Min: 0.00 Bit/s
             ||                                      Max: 3.23 MBit/s
             ##                                      Ttl: 1090.93 GByte
Outgoing:

                                                     Curr: 12.84 kBit/s
                                                     Avg: 15.29 kBit/s
                                                     Min: 0.00 Bit/s
                                                     Max: 206.63 kBit/s
                                                     Ttl: 48.57 GByte
Bandwidth Monitor 1.1.0

       Iface        RX(KB/sec)   TX(KB/sec)   Total(KB/sec)

          lo            8.366        8.366          16.732
        eth0           24.120      100.005         124.125
        eth1            0.000        0.000           0.000

       Total           32.486      108.371         140.857

Hit CTRL-C to end this madness.
# yum install iptstate -y
                           IPTState - IPTables State Top
Version: 2.2.2        Sort: SrcIP           b: change sorting   h: help
Source                        Destination                  Prt  State       TTL
0.0.0.0                       224.0.0.1                    igmp               0:09:49
192.168.2.1:45981             192.168.2.1:22               tcp  TIME_WAIT     0:01:33
192.168.2.1:46009             192.168.2.1:22               tcp  TIME_WAIT     0:01:57
192.168.2.1:45915             192.168.2.1:22               tcp  TIME_WAIT     0:00:58
192.168.2.1:45975             192.168.2.1:22               tcp  TIME_WAIT     0:01:31
192.168.2.1:54922             202.141.160.110:80           tcp  TIME_WAIT     0:00:57
192.168.2.1:46000             192.168.2.1:22               tcp  TIME_WAIT     0:01:54
192.168.2.1:45973             192.168.2.1:22               tcp  TIME_WAIT     0:01:31
192.168.2.1:45855             192.168.2.1:22               tcp  TIME_WAIT     0:00:26
192.168.2.1:45990             192.168.2.1:22               tcp  TIME_WAIT     0:01:36
192.168.2.1:45822             192.168.2.1:22               tcp  TIME_WAIT     0:00:01
192.168.2.1:45926             192.168.2.1:22               tcp  TIME_WAIT     0:01:01
neo@monitor:~$ nfsstat
Client rpc stats:
calls      retrans    authrefrsh
1453045225   19702      744

Client nfs v3:
null         getattr      setattr      lookup       access       readlink
0         0% 114943957  8% 348670069 25% 289174215 20% 133022875  9% 40252     0%
read         write        create       mkdir        symlink      mknod
81907703  5% 99851126  7% 81782798  5% 5528575   0% 3450      0% 427       0%
remove       rmdir        rename       link         readdir      readdirplus
5178074   0% 1021367   0% 79872796  5% 0         0% 7300163   0% 21591431  1%
fsstat       fsinfo       pathconf     commit
30857752  2% 10        0% 5         0% 83581680  6%

Client nfs v4:
null         read         write        commit       open         open_conf
0         0% 3449823   5% 299       0% 248       0% 3494      0% 3066      0%
open_noat    open_dgrd    close        setattr      fsinfo       renew
0         0% 0         0% 3182      0% 1279      0% 385       0% 69        0%
setclntid    confirm      lock         lockt        locku        access
997       0% 997       0% 0         0% 0         0% 0         0% 760098    1%
getattr      lookup       lookup_root  remove       rename       link
1638029   2% 54272     0% 224       0% 4         0% 251       0% 0         0%
symlink      create       pathconf     statfs       readlink     readdir
6         0% 214       0% 193       0% 62872466 91% 391       0% 3601      0%
server_caps  delegreturn  getacl       setacl       fs_locations
578       0% 35        0% 0         0% 0         0% 0         0%
yum install -y nfswatch
J13-85-www                  Mon Sep 19 18:33:54 2011   Elapsed time:   00:00:30
Interval packets:    125711 (network)      61695 (to host)          0 (dropped)
Total packets:       140549 (network)      68996 (to host)          0 (dropped)
                     Monitoring packets from interface eth0
                     int   pct    total                      int   pct    total
NFS3 Read              0    0%        0 TCP Packets        61688  100%    68973
NFS3 Write             0    0%        0 UDP Packets            0    0%        1
NFS Read               0    0%        0 ICMP Packets           0    0%        0
NFS Write              0    0%        0 Routing Control        0    0%        0
NFS Mount              0    0%        0 Addr Resolution        0    0%        3
Port Mapper            0    0%        0 Rev Addr Resol         0    0%        0
RPC Authorization  59257   96%    66197 Ether/FDDI Bdcst       0    0%        3
Other RPC Packets      1    0%        5 Other Packets          7    0%       19
                                 0 file systems
     File Sys        int   pct    total      File Sys        int   pct    total
# yum install apachetop -y
# apachetop
last hit: 00:00:00         atop runtime:  0 days, 00:00:00             09:42:54
All:            0 reqs (   0.0/sec)          0.0B (    0.0B/sec)       0.0B/req
2xx:       0 ( 0.0%) 3xx:       0 ( 0.0%) 4xx:     0 ( 0.0%) 5xx:     0 ( 0.0%)
R (  1s):       0 reqs (   0.0/sec)          0.0B (    0.0B/sec)       0.0B/req
2xx:       0 ( 0.0%) 3xx:       0 ( 0.0%) 4xx:     0 ( 0.0%) 5xx:     0 ( 0.0%)
http://nmon.sourceforge.net/
$ apt-cache search nmon
libtime-modules-perl - Various Perl modules for time/date manipulation
nmon - performance monitoring tool for Linux
xfce4-genmon-plugin - Generic Monitor for the Xfce4 panel
xfce4-goodies - enhancements for the Xfce4 Desktop Environment

neo@monitor:~$ sudo apt-get install nmon

neo@monitor:~$ nmon
nmon -f -s 360 -c 86400 -m /home/user/nmon
lm-sensors - utilities to read temperature/voltage/fan sensors
$ sudo apt-get install lm-sensors
$ sudo sensors-detect
$ sensors
$ sudo apt-get install mcelog
Decode machine check ASCII output from kernel logs
Options:
--cpu CPU           Set CPU type CPU to decode (see below for valid types)
--cpumhz MHZ        Set CPU Mhz to decode time (output unreliable, not needed on new kernels)
--raw		     (with --ascii) Dump in raw ASCII format for machine processing
--daemon            Run in background waiting for events (needs newer kernel)
--ignorenodev       Exit silently when the device cannot be opened
--file filename     With --ascii read machine check log from filename instead of stdin
--syslog            Log decoded machine checks in syslog (default stdout or syslog for daemon)
--syslog-error	     Log decoded machine checks in syslog with error level
--no-syslog         Never log anything to syslog
--logfile filename  Append log output to logfile instead of stdout
--dmi               Use SMBIOS information to decode DIMMs (needs root)
--no-dmi            Don't use SMBIOS information
--dmi-verbose       Dump SMBIOS information (for debugging)
--filter            Inhibit known bogus events (default on)
--no-filter         Don't inhibit known broken events
--config-file filename Read config information from config file instead of /etc/mcelog/mcelog.conf
--foreground        Keep in foreground (for debugging)
--num-errors N      Only process N errors (for testing)
--pidfile file	     Write pid of daemon into file
--no-imc-log	     Disable extended iMC logging
sar 是 System Activity Reporter(系统活动情况报告)的缩写。

sar工具将对系统当前的状态进行取样,然后通过计算数据和比例来表达系统的当前运行状态。它的特点是可以连续对系统取样,获得大量的取样数据;取样数据和分析的结果都可以存入文件,所需的负载很小。sar是目前Linux上最为全面的系统性能分析工具之一,可以从14个大方面对系统的活动进行报告,包括文件的读写情况、系统调用的使用情况、串口、CPU效率、内存使用状况、进程活动及IPC有关的活动等,使用也是较为复杂。

sar命令常用格式
sar [options] [-A] [-o file] t [n]

其中:
    t为采样间隔,n为采样次数,默认值是1;

    -o file表示将命令结果以二进制格式存放在文件中,file 是文件名。

options 为命令行选项,sar命令常用选项如下:

    -A:所有报告的总和

    -u:输出CPU使用情况的统计信息

    -v:输出inode、文件和其他内核表的统计信息

    -d:输出每一个块设备的活动信息

    -r:输出内存和交换空间的统计信息

    -b:显示I/O和传送速率的统计信息

    -a:文件读写情况

    -c:输出进程统计信息,每秒创建的进程数

    -R:输出内存页面的统计信息

    -y:终端设备活动情况

    -w:输出系统交换活动信息

> Report CPU utilization


[root@netkiller ~]# sar -u 1 3
Linux 3.10.5-3.el6.x86_64 (test23) 	2017年03月08日 	_x86_64_	(2 CPU)

15时05分29秒     CPU     %user     %nice   %system   %iowait    %steal     %idle
15时05分30秒     all      0.00      0.00      0.00      0.00      0.00    100.00
15时05分31秒     all      0.00      0.00      0.50      0.00      0.00     99.50
15时05分32秒     all      0.50      0.00      0.00      0.50      0.00     99.00
平均时间:     all      0.17      0.00      0.17      0.17      0.00     99.50

%user:  显示在用户级别(application)运行使用 CPU 总时间的百分比.
%nice:  显示在用户级别,用于nice操作,所占用CPU总时间的百分比.
%system:在核心级别(kernel)运行所使用 CPU 总时间的百分比.
%iowait:显示用于等待I/O操作占用CPU总时间的百分比.
%steal: 管理程序(hypervisor)为另一个虚拟进程提供服务而等待虚拟CPU的百分比.
%idle:  显示CPU空闲时间占用CPU总时间的百分比.

> Report status of inode, file and other kernel tables


[root@netkiller ~]# sar -v  1 3
Linux 3.10.5-3.el6.x86_64 (test23) 	2017年03月08日 	_x86_64_	(2 CPU)

15时07分57秒 dentunusd   file-nr  inode-nr    pty-nr
15时07分58秒     47524       640     46025         2
15时07分59秒     47524       640     46025         2
15时08分00秒     47524       640     46025         2
平均时间:     47524       640     46025         2

dentunusd: 目录缓存中未使用的缓存条目数
file-nr:   由系统使用的文件数
inode-nr: 由系统使用的inode数
pty-nr:   系统所使用的伪终端数

> 查看平均负载


sar -q: 查看平均负载

指定-q后,就能查看运行队列中的进程数、系统上的进程大小、平均负载等;与其它命令相比,它能查看各项指标随时间变化的情况;

[root@netkiller ~]# sar -q 1 3
Linux 3.10.5-3.el6.x86_64 (test23) 	2017年03月08日 	_x86_64_	(2 CPU)

15时24分06秒   runq-sz  plist-sz   ldavg-1   ldavg-5  ldavg-15
15时24分07秒         0       204      0.00      0.01      0.05
15时24分08秒         1       204      0.00      0.01      0.05
15时24分09秒         0       204      0.00      0.01      0.05
平均时间:         0       204      0.00      0.01      0.05

runq-sz: 运行队列的长度(等待运行的进程数)
plist-sz:进程列表中进程(processes)和线程(threads)的数量
ldavg-1: 最后1分钟的系统平均负载
ldavg-5: 过去5分钟的系统平均负载
ldavg-15:过去15分钟的系统平均负载

> Report memory statistics


[root@kvm ~]# sar -R 1 5
Linux 2.6.32-358.11.1.el6.x86_64 (kvm)  11/04/2013      _x86_64_        (24 CPU)

04:12:49 PM   frmpg/s   bufpg/s   campg/s
04:12:50 PM   -174.00      0.00      0.00
04:12:51 PM    -27.08      0.00      0.00
04:12:52 PM    -73.27      0.00      0.00
04:12:53 PM   -498.00      0.00      0.00
04:12:54 PM    322.00      0.00      0.00
Average:       -90.54      0.00      0.00

frmpg/s :每秒钟系统释放的内存页数. 如果是负值,表示每秒钟被系统分配的内存页数.
bufpg/s :每秒钟系统分配多少内存页作为buffer使用. 如果是负值,表示系统在回收一定的buffer空间.
campg/s :每秒钟系统分配多少内存页作为bcached使用. 如果是负值,表示系统在回收一定的cached空间.

> 查看页面交换发生状况


[root@kvm ~]# sar -W
Linux 2.6.32-358.11.1.el6.x86_64 (kvm)  11/04/2013      _x86_64_        (24 CPU)

12:00:01 AM  pswpin/s pswpout/s
12:10:01 AM      0.00      0.00
12:20:01 AM      0.00      0.00
12:30:01 AM      0.00      0.00
12:40:01 AM      0.00      0.00
12:50:01 AM      0.00      0.00

pswpin/s
    Total number of swap pages the system brought in per second.

pswpout/s
    Total number of swap pages the system brought out per second.

> Report task creation and system switching activity


[root@kvm ~]# sar -w 1 5
Linux 2.6.32-358.11.1.el6.x86_64 (kvm) 	11/05/2013 	_x86_64_	(24 CPU)

03:09:01 PM    proc/s   cswch/s
03:09:02 PM      1.00  21017.00
03:09:03 PM      1.02  18507.14
03:09:04 PM      1.00  20803.00
03:09:05 PM      0.99  17787.13
03:09:06 PM      1.04  22041.67
Average:         1.01  20016.57

proc/s: 每秒创建的任务的总数.
cswch/s:每秒上下文切换的总数.

> Report I/O and transfer rate statistics.


[root@kvm ~]# sar -b 1 5
Linux 2.6.32-358.11.1.el6.x86_64 (kvm) 	11/05/2013 	_x86_64_	(24 CPU)

03:20:15 PM       tps      rtps      wtps   bread/s   bwrtn/s
03:20:16 PM     18.00      0.00     18.00      0.00    383.00
03:20:17 PM      5.05      0.00      5.05      0.00     72.73
03:20:18 PM      0.00      0.00      0.00      0.00      0.00
03:20:19 PM      0.00      0.00      0.00      0.00      0.00
03:20:20 PM      0.00      0.00      0.00      0.00      0.00
Average:         4.60      0.00      4.60      0.00     91.00

tps:    每秒钟向物理设备发出请求(读与写)的总数
rtps:    每秒钟向物理设备发出读请求的总数
wtps:    每秒钟向物理设备发出写请求的总数
bread/s: 每秒从块设备中读取的数据总数
bwrtn/s: 每秒向块设备中写入的数据总数

> Report paging statistics


[root@kvm ~]# sar -B 1 5
Linux 2.6.32-358.11.1.el6.x86_64 (kvm) 	11/05/2013 	_x86_64_	(24 CPU)

03:36:32 PM  pgpgin/s pgpgout/s   fault/s  majflt/s  pgfree/s pgscank/s pgscand/s pgsteal/s    %vmeff
03:36:33 PM    192.00    384.00   1125.00      0.00   1709.00      0.00      0.00      0.00      0.00
03:36:34 PM      0.00     16.16    240.40      0.00    935.35      0.00      0.00      0.00      0.00
03:36:35 PM      0.00      1.01    273.74      0.00   1009.09      0.00      0.00      0.00      0.00
03:36:36 PM      0.00    396.04   1052.48      0.00    878.22      0.00      0.00      0.00      0.00
03:36:37 PM      0.00      0.00    228.00      0.00    997.00      0.00      0.00      0.00      0.00
Average:        38.48    160.52    586.17      0.00   1105.81      0.00      0.00      0.00      0.00

pgpgin/s:  每秒从磁盘或SWAP置换到内存的字节数
pgpgout/s: 每秒从内存置换到磁盘或SWAP的字节数
fault/s:   每秒钟系统产生的缺页数,即主缺页与次缺页之和(major + minor)
majflt/s: 每秒钟产生的主缺页数
pgfree/s:  每秒被放入空闲队列中的页个数
pgscank/s: 每秒被kswapd扫描的页个数
pgscand/s: 每秒直接被扫描的页个数
pgsteal/s: 每秒钟从cache中被回收来满足内存需要的页个数
%vmeff:    每秒回收的页(pgsteal)占总扫描页(pgscank+pgscand)的百分比

缺页异常:
	major(内存中没有需要的数据)
	minor (内存中有这样的数据,单最先不是该进程的)

> Report network statistics


sar命令使用-n选项可以汇报网络相关信息,可用的参数包括:DEV、EDEV、SOCK和FULL。

1) 如果你使用DEV关键字,那么sar将汇报和网络设备相关的信息,如lo,eth0或eth1等

[root@netkiller ~]# sar -n DEV 1 1
Linux 3.10.5-3.el6.x86_64 (test23) 	2017年03月08日 	_x86_64_	(2 CPU)

15时30分12秒     IFACE   rxpck/s   txpck/s    rxkB/s    txkB/s   rxcmp/s   txcmp/s  rxmcst/s
15时30分13秒       br0      3.03      1.01      0.14      0.16      0.00      0.00      0.00
15时30分13秒      eth0      3.03      1.01      0.18      0.16      0.00      0.00      0.00
15时30分13秒        lo      2.02      2.02      0.09      0.09      0.00      0.00      0.00
15时30分13秒   docker0      0.00      0.00      0.00      0.00      0.00      0.00      0.00

平均时间:     IFACE   rxpck/s   txpck/s    rxkB/s    txkB/s   rxcmp/s   txcmp/s  rxmcst/s
平均时间:       br0      3.03      1.01      0.14      0.16      0.00      0.00      0.00
平均时间:      eth0      3.03      1.01      0.18      0.16      0.00      0.00      0.00
平均时间:        lo      2.02      2.02      0.09      0.09      0.00      0.00      0.00
平均时间:   docker0      0.00      0.00      0.00      0.00      0.00      0.00      0.00

IFACE:就是网络设备的名称;

rxpck/s:每秒钟接收到的包数目

txpck/s:每秒钟发送出去的包数目

rxbyt/s:每秒钟接收到的字节数

txbyt/s:每秒钟发送出去的字节数

rxcmp/s:每秒钟接收到的压缩包数目

txcmp/s:每秒钟发送出去的压缩包数目

txmcst/s:每秒钟接收到的多播包的包数目

2) 如果你使用EDEV关键字,那么会针对网络设备汇报其失败情况,例如:
[root@netkiller ~]# sar -n EDEV 1  1
Linux 3.10.5-3.el6.x86_64 (test23) 	2017年03月08日 	_x86_64_	(2 CPU)

15时31分29秒     IFACE   rxerr/s   txerr/s    coll/s  rxdrop/s  txdrop/s  txcarr/s  rxfram/s  rxfifo/s  txfifo/s
15时31分30秒       br0      0.00      0.00      0.00      0.00      0.00      0.00      0.00      0.00      0.00
15时31分30秒      eth0      0.00      0.00      0.00      0.00      0.00      0.00      0.00      0.00      0.00
15时31分30秒        lo      0.00      0.00      0.00      0.00      0.00      0.00      0.00      0.00      0.00
15时31分30秒   docker0      0.00      0.00      0.00      0.00      0.00      0.00      0.00      0.00      0.00

平均时间:     IFACE   rxerr/s   txerr/s    coll/s  rxdrop/s  txdrop/s  txcarr/s  rxfram/s  rxfifo/s  txfifo/s
平均时间:       br0      0.00      0.00      0.00      0.00      0.00      0.00      0.00      0.00      0.00
平均时间:      eth0      0.00      0.00      0.00      0.00      0.00      0.00      0.00      0.00      0.00
平均时间:        lo      0.00      0.00      0.00      0.00      0.00      0.00      0.00      0.00      0.00
平均时间:   docker0      0.00      0.00      0.00      0.00      0.00      0.00      0.00      0.00      0.00

rxerr/s:每秒钟接收到的损坏的包的数目

txerr/s:当发送包时,每秒钟发生的错误数

coll/s: 当发送包时,每秒钟发生的冲撞(collisions)数(这个是在半双工模式下才有)

rxdrop/s:由于缓冲区满,网络设备接收端,每秒钟丢掉的网络包的数目

txdrop/s:由于缓冲区满,网络设备发送端,每秒钟丢掉的网络包的数目

txcarr/s:当发送数据包时,每秒钟载波错误发生的次数

rxfram/s:在接收数据包时,每秒钟发生的帧对齐错误的次数

rxfifo/s:在接收数据包时,每秒钟缓冲区溢出错误发生的次数

txfifo/s:在发送数据包时,每秒钟缓冲区溢出错误发生的次数


3) 如果你使用SOCK关键字,则会针对socket连接进行汇报,例如:
[root@netkiller ~]# sar -n SOCK 1  1
Linux 3.10.5-3.el6.x86_64 (test23) 	2017年03月08日 	_x86_64_	(2 CPU)

15时33分29秒    totsck    tcpsck    udpsck    rawsck   ip-frag    tcp-tw
15时33分30秒        86        47         0         0         0        67
平均时间:        86        47         0         0         0        67

totsck:被使用的socket的总数目

tcpsck:当前正在被使用于TCP的socket数目

udpsck:当前正在被使用于UDP的socket数目

rawsck:当前正在被使用于RAW的socket数目

ip-frag:当前的IP分片的数目

## iostat


通过iostat方便查看CPU、网卡、tty设备、磁盘、CD-ROM 等等设备的活动情况, 负载信息。

命令格式
iostat[参数][时间][次数]

-C 显示CPU使用情况
-d 显示磁盘使用情况
-k 以 KB 为单位显示
-m 以 M 为单位显示
-N 显示磁盘阵列(LVM) 信息
-n 显示NFS 使用情况
-p[磁盘] 显示磁盘和分区的情况
-t 显示终端和CPU的信息
-x 显示详细信息
-V 显示版本信息


[root@netkiller ~]# iostat  -k
Linux 3.10.5-3.el6.x86_64 (test23) 	2017年03月07日 	_x86_64_	(2 CPU)

avg-cpu:  %user   %nice %system %iowait  %steal   %idle
           0.14    0.00    0.23    0.39    0.00   99.25

Device:            tps    kB_read/s    kB_wrtn/s    kB_read    kB_wrtn
sda               8.65        28.46        95.63   54368942  182705652
dm-0              0.01         0.01         0.19      21684     366024

[root@netkiller ~]# iostat -x
Linux 3.10.5-3.el6.x86_64 (test23) 	2017年03月07日 	_x86_64_	(2 CPU)

avg-cpu:  %user   %nice %system %iowait  %steal   %idle
           0.14    0.00    0.23    0.39    0.00   99.25

Device:         rrqm/s   wrqm/s     r/s     w/s   rsec/s   wsec/s avgrq-sz avgqu-sz   await r_await w_await  svctm  %util
sda               0.00     3.31    0.49    8.16    56.95   191.26    28.70     0.03    3.95    1.85    4.07   0.95   0.82
dm-0              0.00     0.00    0.00    0.01     0.02     0.38    40.84     0.00   24.60    8.99   25.69   0.77   0.00

>cpu属性值说明


%user:  CPU处在用户模式下的时间百分比
%nice:  CPU处在带NICE值的用户模式下的时间百分比
%system:CPU处在系统模式下的时间百分比
%iowait:CPU等待输入输出完成时间的百分比
%steal: 管理程序维护另一个虚拟处理器时,虚拟CPU的无意识等待时间百分比
%idle:  CPU空闲时间百分比

> disk属性值说明


rrqm/s:     每秒进行 merge 的读操作数目.即 delta(rmerge)/s
wrqm/s:     每秒进行 merge 的写操作数目.即 delta(wmerge)/s
r/s:        每秒完成的读 I/O 设备次数.即 delta(rio)/s
w/s:        每秒完成的写 I/O 设备次数.即 delta(wio)/s
rsec/s:     每秒读扇区数.即 delta(rsect)/s
wsec/s:     每秒写扇区数.即 delta(wsect)/s
rkB/s:      每秒读K字节数.是 rsect/s 的一半,因为每扇区大小为512字节.(需要计算)
wkB/s:      每秒写K字节数.是 wsect/s 的一半.(需要计算)
avgrq-sz:   平均每次设备I/O操作的数据大小 (扇区).delta(rsect+wsect)/delta(rio+wio)
avgqu-sz:   平均I/O队列长度.即 delta(aveq)/s/1000 (因为aveq的单位为毫秒).
await:      平均每次设备I/O操作的等待时间 (毫秒).即 delta(ruse+wuse)/delta(rio+wio)
svctm:      平均每次设备I/O操作的服务时间 (毫秒).即 delta(use)/delta(rio+wio)
%util:      一秒中有百分之多少的时间用于 I/O 操作,或者说一秒中有多少时间 I/O 队列是非空的.即 delta(use)/s/1000 (因为use的单位为毫秒)

如果 %util 接近 100%,说明产生的I/O请求太多,I/O系统已经满负荷,该磁盘可能存在瓶颈.

idle小于70% IO压力就较大了,一般读取速度有较多的wait.同时可以结合vmstat 查看查看b参数(等待资源的进程数)和wa参数(IO等待所占用的CPU时间的百分比,高过30%时IO压力高)

另外 await 的参数也要多和 svctm 来参考.差的过高就一定有 IO 的问题.一般地系统IO响应时间(await)应该低于5ms,如果大于10ms就比较大了.

avgqu-sz 也是个做 IO 调优时需要注意的地方,这个就是直接每次操作的数据的大小,如果次数多,但数据拿的小的话,其实 IO 也会很小.如果数据拿的大,才IO 的数据会高.也可以通过 avgqu-sz × ( r/s or w/s ) = rsec/s or wsec/s.也就是讲,读定速度是这个来决定的.

一个不错的例子.(I/O 系统 vs. 超市排队)

举一个例子,我们在超市排队 checkout 时,怎么决定该去哪个交款台呢?
    首当是看排的队人数,5个人总比20人要快吧?
    除了数人头,我们也常常看看前面人购买的东西多少,如果前面有个采购了一星期食品的大妈,那么可以考虑换个队排了.
    还有就是收银员的速度了,如果碰上了连 钱都点不清楚的新手,那就有的等了.
    另外,时机也很重要,可能 5 分钟前还人满为患的收款台,现在已是人去楼空,这时候交款可是很爽啊,当然,前提是那过去的 5 分钟里所做的事情比排队要有意义

I/O 系统也和超市排队有很多类似之处:
    r/s+w/s 类似于交款人的总数

    平均队列长度(avgqu-sz)类似于单位时间里平均排队人的个数

    平均服务时间(svctm)类似于收银员的收款速度

    平均等待时间(await)类似于平均每人的等待时间

    平均I/O数据(avgrq-sz)类似于平均每人所买的东西多少

    I/O 操作率 (%util)类似于收款台前有人排队的时间比例.

我们可以根据这些数据分析出 I/O 请求的模式,以及 I/O 的速度和响应时间.

> 下面是别人写的这个参数输出的分析


// # iostat -x 1
avg-cpu: %user %nice %sys %idle
16.24 0.00 4.31 79.44
Device:              rrqm/s wrqm/s r/s   w/s    rsec/s wsec/s rkB/s  wkB/s  avgrq-sz  avgqu-sz await svctm %util
/dev/cciss/c0d0      0.00   44.90 1.02  27.55    8.16  579.59 4.08   289.80  20.57      22.35  78.21  5.00 14.29

上面的 iostat 输出表明秒有 28.57 次设备 I/O 操作: 总IO(io)/s = r/s(读) +w/s(写) = 1.02+27.55 = 28.57 (次/秒) 其中写操作占了主体 (w:r = 27:1).

平均每次设备 I/O 操作只需要 5ms 就可以完成,但每个 I/O 请求却需要等上 78ms,为什么? 因为发出的 I/O 请求太多 (每秒钟约 29 个),假设这些请求是同时发出的,那么平均等待时间可以这样计算:

平均等待时间 = 单个 I/O 服务时间 * ( 1 + 2 + … + 请求总数-1) / 请求总数

应用到上面的例子: 平均等待时间 = 5ms * (1+2+…+28)/29 = 70ms,和 iostat 给出的78ms 的平均等待时间很接近.这反过来表明 I/O 是同时发起的.

每秒发出的 I/O 请求很多 (约 29 个),平均队列却不长 (只有 2 个 左右),这表明这 29 个请求的到来并不均匀,大部分时间 I/O 是空闲的.

一秒中有 14.29% 的时间 I/O 队列中是有请求的,也就是说,85.71% 的时间里 I/O 系统无事可做,所有 29 个 I/O 请求都在142毫秒之内处理掉了.

delta(ruse+wuse)/delta(io) = await = 78.21 => delta(ruse+wuse)/s =78.21 * delta(io)/s = 78.21*28.57 = 2232.8,表明每秒内的I/O请求总共需要等待2232.8ms.所以平均队列长度应为 2232.8ms/1000ms = 2.23,
而 iostat 给出的平均队列长度 (avgqu-sz) 却为 22.35,为什么?! 因为 iostat 中有 bug,avgqu-sz 值应为 2.23,而不是 22.35.


## vmstat

vmstat是Virtual Meomory Statistics(虚拟内存统计)的缩写,可实时动态监视操作系统的虚拟内存、进程、CPU活动.

vmstat的语法
  vmstat [-V] [-n] [delay [count]]

r,  可运行队列的线程数, 这些线程都是可运行状态, 只不过 CPU 暂时不可用.
b,  被 blocked 的进程数, 正在等待 IO 请求;
in, 每秒被处理过的中断数
cs, 每秒系统上正在做上下文切换的数目
us, 用户占用 CPU 的百分比
sy, 内核和中断占用 CPU 的百分比
wa, 所有可运行的线程被 blocked 以后都在等待 IO, 这时候 CPU 空闲的百分比
id, CPU 完全空闲的百分比

swpd: 使用虚拟内存大小
free: 可用内存大小
buff: 用作缓冲的内存大小
cache: 用作缓存的内存大小

si: 每秒从交换区写到内存的大小
so: 每秒写入交换区的内存大小

bi: 每秒读取的块数
bo: 每秒写入的块数


### badblocks

badblock 命令用于查找磁盘中损坏的区块.

badblock (options)  (参数)

options:
    -b<区块大小>: 指定磁盘的区块大小,单位为字节
    -o<输出文件>: 将检查的结果写入指定的输出文件
    -c: 每个区块检查的次数,默认是16次
    -s: 在检查时显示进度
    -v: 执行时显示详细的信息
    -w: 在检查时,执行写入测试

 参数:
    磁盘装置:  指定要检查的磁盘装置
    磁盘区块数:指定磁盘装置的区块总数
    启始区块:  指定要从哪个区块开始检查

// 检查硬盘是否产生坏道并输出到badblocks.log中
badblocks -s -v -o /root/badblocks.log /dev/sda


// badblocks以4096字节为一个“block”,每一个“block”检查1次, 将结果输出到“hda-badblocks-list.1”文件中,由第51000 block开始,到63000 block结束
badblocks -b 4096 -c 1 /dev/hda1 -o hda-badblocks-list.1 63000 51000

> 利用硬盘的重分配特性修复坏道


1) 硬盘上的芯片存有一个GList,里面存储着盘面上的坏道信息,当读写到其记录的地址时会自动重映射另一个地址来代替损坏的区域.
而往其中添加内容很简单:只要往坏道上写数据(读不行),硬盘会自动重映射.

badblocks -w [-f] /dev/sdXX [-s -b4096] end start

    -w:写入命令, 通过在坏道地址强制写入来让硬盘自动重映射.
    -f:强制写入, 在已确定目标不被系统读写而-w仍然拒绝写入时使用.这个参数应该尽量避免!
    end,start:强制写入的开始和终止块地址, 与-b制定的大小相配和.

2) 使用fsck -a /dev/sda1


磁盘坏道分为三种:0磁道坏道,逻辑坏道,硬盘坏道。

    其中逻辑坏道可以使用上面的方法修复,0磁道坏道的修复方法是隔离0磁道,使用fdsk划分区的时候从1磁道开始划分区。

    如果是硬盘坏道的话,只能隔离不能修复。

    硬盘坏道的监测方法:使用上述方法检测修复后,再使用badblocks -s -v -o /root/badblocks.log /dev/sda监测看是否还有坏道存在,如果坏道还是存在的话说明坏道属于硬盘坏道。

    硬盘坏道隔离方法,首先记录监测出的硬盘坏道,然后分区的时候把硬盘坏道所在的扇区分在一个分区(大小一般大于坏扇区大小),划分出的坏道分区不使用即可达到隔离的目的。隔离只是暂时方案,建议尽快更换硬盘,因为坏道会扩散,以免以后出现严重的数据问题。
jps: http://java.sun.com/j2se/1.5.0/docs/tooldocs/share/jps.html
jstat: http://java.sun.com/j2se/1.5.0/docs/tooldocs/share/jstat.html
jmap: http://java.sun.com/j2se/1.5.0/docs/tooldocs/share/jmap.html
jconsole: http://java.sun.com/j2se/1.5.0/docs/guide/management/jconsole.html
java -jar -Djava.rmi.server.hostname=192.168.0.1 -Dcom.sun.management.jmxremote -Dcom.sun.management.jmxremote.port=911 -Dcom.sun.management.jmxremote.ssl=false -Dcom.sun.management.jmxremote.authenticate=false netkiller-1.0-SNAPSHOT.jar
如果是云主机,配置 java.rmi.server.hostname=192.168.0.1 为内网IP地址,这样只能从内网监控 JVM。如果仅仅是开发调试可以不用设置 java.rmi.server.hostname
java -jar -Dcom.sun.management.jmxremote -Dcom.sun.management.jmxremote.port=911 -Dcom.sun.management.jmxremote.ssl=false -Dcom.sun.management.jmxremote.authenticate=false netkiller-1.0-SNAPSHOT.jar
启动 jconsole
jconsole localhost:911
观察运行中的java程序的运行环境参数:参数包括Java System属性,各种.properties文件配置参数和JVM命令行参数
# jinfo $(pgrep java)
Attaching to process ID 15888, please wait...
Debugger attached successfully.
Server compiler detected.
JVM version is 24.72-b04
Java System Properties:

java.vendor = Oracle Corporation
sun.java.launcher = SUN_STANDARD
catalina.base = /srv/apache-tomcat
sun.management.compiler = HotSpot 64-Bit Tiered Compilers
catalina.useNaming = true
captcha.times = 5
os.name = Linux

...
...

java.vm.name = Java HotSpot(TM) 64-Bit Server VM
cpool.maxIdleTime = 7200
file.encoding = UTF-8
java.specification.version = 1.7

VM Flags:

-Djava.util.logging.config.file=/srv/apache-tomcat/conf/logging.properties -Djava.util.logging.manager=org.apache.juli.ClassLoaderLogManager -Xms512m -Xmx8192m -XX:PermSize=64M -XX:MaxPermSize=512m -Djava.endorsed.dirs=/srv/apache-tomcat/endorsed -Dcatalina.base=/srv/apache-tomcat -Dcatalina.home=/srv/apache-tomcat -Djava.io.tmpdir=/srv/apache-tomcat/temp
实例二
# jinfo $(jps | grep Bootstrap | cut -d " " -f1)
Attaching to process ID 15888, please wait...
Debugger attached successfully.
Server compiler detected.
JVM version is 24.72-b04
Java System Properties:

java.vendor = Oracle Corporation
sun.java.launcher = SUN_STANDARD
catalina.base = /srv/apache-tomcat
sun.management.compiler = HotSpot 64-Bit Tiered Compilers
catalina.useNaming = true
captcha.times = 5
os.name = Linux
# jstat -class 15888 1000 10
Loaded Bytes Unloaded Bytes Time
17409 34782.5 231 339.0 13.21
17409 34782.5 231 339.0 13.21
17409 34782.5 231 339.0 13.21
17409 34782.5 231 339.0 13.21
17409 34782.5 231 339.0 13.21
17409 34782.5 231 339.0 13.21
# jstat -gc 15888 1000 10
S0C S1C S0U S1U EC EU OC OU PC PU YGC YGCT FGC FGCT GCT
13824.0 13824.0 1204.1 0.0 2766848.0 2327059.3 349696.0 318073.6 229888.0 101912.6 288 4.895 2 1.055 5.949
13824.0 13824.0 1204.1 0.0 2766848.0 2327059.3 349696.0 318073.6 229888.0 101912.6 288 4.895 2 1.055 5.949
13824.0 13824.0 1204.1 0.0 2766848.0 2327059.3 349696.0 318073.6 229888.0 101912.6 288 4.895 2 1.055 5.949
13824.0 13824.0 1204.1 0.0 2766848.0 2327059.3 349696.0 318073.6 229888.0 101912.6 288 4.895 2 1.055 5.949
# jstat -gcutil 15888
S0 S1 E O P YGC YGCT FGC FGCT GCT
8.71 0.00 84.12 90.96 44.33 288 4.895 2 1.055 5.949
# jstat -compiler 15888
Compiled Failed Invalid Time FailedType FailedMethod
2987 0 0 59.55 0
# jstat -gccapacity 15888
NGCMN NGCMX NGC S0C S1C EC OGCMN OGCMX OGC OC PGCMN PGCMX PGC PC YGC FGC
175104.0 2796544.0 2794496.0 13824.0 13824.0 2766848.0 349696.0 5592064.0 349696.0 349696.0 65536.0 524288.0 229888.0 229888.0 288 2
# jstat -gcnew 15888
S0C S1C S0U S1U TT MTT DSS EC EU YGC YGCT
13824.0 13824.0 1204.1 0.0 1 15 13824.0 2766848.0 2327429.8 288 4.895
# jstat -gcnewcapacity 15888
NGCMN NGCMX NGC S0CMX S0C S1CMX S1C ECMX EC YGC FGC
175104.0 2796544.0 2794496.0 931840.0 13824.0 931840.0 13824.0 2795520.0 2766848.0 288 2
# jstat -gcold 15888
PC PU OC OU YGC FGC FGCT GCT
229888.0 101912.6 349696.0 318073.6 288 2 1.055 5.949
# jstat -gcoldcapacity 15888
OGCMN OGCMX OGC OC YGC FGC FGCT GCT
349696.0 5592064.0 349696.0 349696.0 288 2 1.055 5.949
每 1000 毫秒打印一次,一共打印 5 次,还可以加上 -h3 每三行显示一下标题。
# jstat -printcompilation -h3 15888
Compiled Size Type Method
2987 91 1 org/apache/catalina/connector/Request isAlpha
npm install -g wscat
wscat -c ws://echo.websocket.org
curl --include \
     --no-buffer \
     --header "Connection: Upgrade" \
     --header "Upgrade: websocket" \
     --header "Host: echo.websocket.org" \
     --header "Origin: https://echo.websocket.org" \
     --header "Sec-WebSocket-Key: NVwjmQUcWCenfWu98asDmg==" \
     --header "Sec-WebSocket-Version: 13" \
     http://echo.websocket.org
Transaction Processing Performance Council
TPC-C:是在线事务处理(OLTP)的基准程序
TPC-D:是决策支持(Decision Support) 的基准程序
TPC-E:作为大型企业(Enterprise)信息服务的基准程序
TPC-H:DecisionSupportforAdHocQueries基于特定查询的决策支持
TPC-W:Webe-Commerce(互联网及电子商务)
TPC-R:DecisionSupportforBusinessReporting(基于商业报告的决策支持)
http://www-03.ibm.com/systems/power/hardware/notices/rperf.html
服务器所需要的rPerf值=SUM(NU * TX * CS/PP) / MC

NU:高峰时并发的用户数

TX:高峰时每个用户的交易数量

CS:在rPerf=1的服务器上,每个交易所需要的CPU秒

PP:高峰持续的时间

MC:最大的CPU利用率(推荐< 70%)

下面举例说明如何计算所需的rPerf值,假定某公司的情况如下:

业务高峰时间:  10:00-11:00=1Hour=3600秒

交易类型:      无复杂查询的简单应用

相对交易类型,用户数目分布:轻的=2000,   一般=50,   重的=5

在高峰时,每个用户的交易数量:

   轻的=120交易/用户

   一般=60交易/用户

   重的=15交易/用户

对于rPerf=1的服务器,每个交易响应的CPU秒

   轻的=1

   一般=3

   重的=15

最大的CPU利用率:60%

根据上述公式,可推算出不同交易类型所对应的rPerf值。

轻的交易:NU*TX*CS/PP=2000*120*1/3600=66.0

一般交易:NU*TX*CS/PP=50*60*3/3600=2.5

重的交易:NU*TX*CS/PP=5*15*15/3600=0.3

所需的总的rPerf/MC=(66.0+2.5+0.3)/0.7=98.3 rPerf